The sheer volume of applications and devices on the market, paired with the rise of social media, has led to a flood of network traffic, putting network performance in jeopardy. As a result, IT departments are bombarded with service requests regarding pesky delays, broken images, dropped calls, and fragmented video conferences, all of which bring productivity to a standstill.
This is where QoS, meaning quality of service, in networking comes into play. Folded into most network monitoring tools is the ability to manage and monitor network traffic by a class of service methods. These QoS monitoring tools can empower system administrators to determine whether the QoS policies they have in place are effectively prioritizing traffic and providing a positive end-user experience.
While there are many network monitoring options on the market, my favorite is SolarWinds® NetFlow Traffic Analyzer. This robust platform gets to the heart of QoS monitoring and is easy to use, allowing system administrators at organizations large and small to hit the ground running the moment it’s installed.
What Is QoS and Why Is It Required?
Why Is QoS in Networking Important?
How QoS Works Within Your Network
The Role of QoS Mechanisms
Best QoS Tools
Getting Started With QoS in Networking
What Is QoS and Why Is It Required?
To truly understand the role of quality of service in networking, we must look at the meaning of QoS in general. I like to think of QoS as a form of traffic control. Every day, a company’s network is bombarded by an onslaught of traffic. Some of this traffic is critical to the success of business operations, and some, while important, isn’t as critical or doesn’t require time-sensitive delivery.
For example, many companies rely on File Transfer Protocol (FTP) as well as video-conferencing applications like Zoom or GoToMeeting. While both are paramount to employee productivity, FTP packets are not nearly as latency-sensitive as Voice over Internet Protocol (VoIP) packets. If delayed, FTP packets will still arrive intact. A delayed VoIP packet, on the other hand, runs the risk of arriving fragmented, ultimately resulting in disjointed video calls and ineffective business meetings.
To better manage the mountainous amount of data packets traveling across a network, QoS policing has developed. Think of QoS policies as the traffic cop directing drivers during a busy 5K road race. In the same way, a traffic cop evaluates when to prioritize drivers versus runners, QoS policies allow network administrators to prioritize which applications should receive delivery preference over others.
QoS policies are required for any company relying on latency-sensitive applications—think media streaming, host video calls, and so on—within their daily operations. They are “required” since they’re integral to the functioning and performance of your latency-sensitive applications. Without QoS policies in place, the quality of the data delivered can be greatly compromised.
Why Is QoS in Networking Important?
QoS helps system administrators optimize their network performance and remain compliant by performing several key functions, including:
- Latency Reduction: Network latency—any sort of delay in network system transactions—is an all-too-common occurrence for many IT technicians. If Real-time Transport Protocol (RTP) packets, such as those for video conferencing, are left without QoS classification, they’ll traverse the network unmarked and be treated as an ordinary piece of data. The absence of prioritization can lead to major consequences, especially in large networks prone to congestion, meaning videos and audio will be choppy, rendering them utterly ineffective for users on both ends—a headache for any organization. A system administrator’s goal is to reduce latency as much as possible, which is why QoS in networking is needed.
- Jitter Reduction: Jitter refers to the irregular speed of packets as a result of deviations in signal pulses. Different factors can cause jitter, from electromagnetic interference to cross-talk with other signals. To the end user, these late and potentially out-of-sequence packets appear in the form of flickering monitors, blatant gaps in audio and video, and more. QoS drastically minimizes the occurrence of jitter.
- Packet Loss Prevention: I’ve yet to meet a system administrator who doesn’t dread the occurrence of packet loss. Packet loss—or the failure of a packet to arrive at its destination—is the result of an onslaught of congestion within the networking device. When this happens, the router or switch simply disregards incoming packets until more space is available, resulting in broken images or unintelligible audio. QoS helps manage the flow of traffic by prioritizing packets and warding off potential traffic jams, so network devices don’t have to drop packets entirely.
- Security Enhancements: QoS is an integral part of secure network design. QoS mechanisms can stop traffic in its path, a powerful and useful capability if compromised traffic is about to enter the network. They also ensure encrypted packets can be prioritized by enabling the placement of prioritization markers (which I’ll discuss in the next section) in the IP header.
How QoS Works Within Your Network
Integrative services (IntServ) and differentiated services (DiffServ) models empower administrators to put QoS into play and manage their network traffic. IntServ homes in on a network’s bandwidth and relies on the Resource Reservation Protocol (RSVP) to perform its duties. With IntServ, applications must request a resource reservation (such as bandwidth) for each data flow before sending data. Network devices then act as the “traffic cop” to determine what network resources are available and whether there are enough to accept the packet at hand. If accepted, the application data can flow as long as it remains within the initially requested traffic profile. To leverage IntServ, system admins must ensure they’re using IntServ-capable routers. One word of warning: while IntServ is an effective method of QoS policing, it consumes numerous network resources and thus is not recommended for companies looking to scale their operations.
DiffServ is probably the most common QoS model. With DiffServ, system administrators assign a Differentiated Services Code Point (DSCP) value, ranging from 0 to 63, to each network traffic type, classifying it at the Internet Protocol (IP) level based on a predetermined set of requirements and groupings known as Traffic Classes (TCs). This value can be placed in an IPv4 packet header as well as the TC field in IPv6. Applications with a high-priority DSCP value can travel the network without delay—they’re the top “runners” the traffic cop is waving through. Unlike IntServ, DiffServ can easily be scaled, making it the go-to choice for many system administrators.
While DiffServ and IntServ are the most common QoS models, I’d be remiss if I didn’t mention Best Effort. Best Effort is by far the simplest of the three services, since it doesn’t rely on QoS classification and prioritization in the slightest. As a result, it’s largely only used as the default model for the internet, or when the network resources are ample enough to support all QoS application requirements (a rare occurrence).
The Role of QoS Mechanisms
Both DiffServ and IntServ rely on QoS mechanisms to perform their optimization duties and fulfill application requirements. I’ve outlined the five core QoS mechanisms here to help further answer the question, “What is QoS?” Each of these mechanisms is unique, but many of them function in tandem.
- Classification and Marking: This mechanism comprises two tactics working together to manage and prioritize network traffic. First, classification tools examine the type of data within each packet and then classify it by network traffic type, such as VoIP or audio over IP (AoIP). Once a classification has been determined, the marking part of the process occurs. A packet’s marking allows devices on the network to determine its priority level. Packets with high-priority classification markings will receive top treatment and never get dropped by congestion management tactics, which I’ll address next. Overall, this mechanism is mostly used to manage routers, switches, and other access points.
- Congestion Management: Congestion management evaluates the markings on each packet and then queues them appropriately based on a set of elaborate algorithms. Queuing can take several forms, including First In, First Out (FIFO); Priority Queuing (PQ); Custom Queuing (CQ); Weighted Fair Queuing (WFQ); and Low Latency Queuing (LLQ).
- Congestion Avoidance: This mechanism monitors network traffic, identifying areas at risk of becoming congested. If a traffic jam appears to be on the horizon, congestion avoidance mechanisms will drop low-priority packets to keep high-priority data on course. This specific method is known as Weighted Random Early Detection (WRED).
- Policing and Shaping: Policing and shaping are similar—they’re both used to manipulate, or condition, traffic entering the network. However, they’re slightly different in their approach and can be used as a pair. Policing helps ward off spikes in traffic by limiting the rate at which data can flow. Only data compliant with agreed traffic parameters, such as prescribed bandwidth, can pass through the policing mechanism. This helps ensure compliance with all service-level agreements (SLAs). Traffic shaping comes into play when traffic needs to be shaped to comply with SLAs and policing mechanisms. To “shape” the traffic simply means to manipulate it, prioritizing applications that must occur in real-time, like video conferencing, and dropping less time-sensitive ones. Types of shaping include Generic Traffic Shaping and Frame Relay Traffic Shaping.
- Link Efficiency: Unlike the other mechanisms listed here, link efficiency is not exclusive to QoS, but it’s still an instrumental part of service optimization. Link efficiency mechanisms are used to reduce delay, jitter, and IP overhead as well as maximize bandwidth. Examples of link efficiency tools include the Real-time Transport Protocol and the Transmission Control Protocol (TCP). Both perform header compression, and TCP can even be used for link compression.
Best QoS Tools
To reap the full benefits of QoS models and mechanisms prioritizing network traffic, system administrators must keep their finger on the pulse of their network. Network performance analyzers provide IT teams with a comprehensive view of their network traffic in real-time, so they can quickly pinpoint issues and take proactive measures to prevent them from reoccurring. The following are my favorite QoS tools of currently available on the market today.
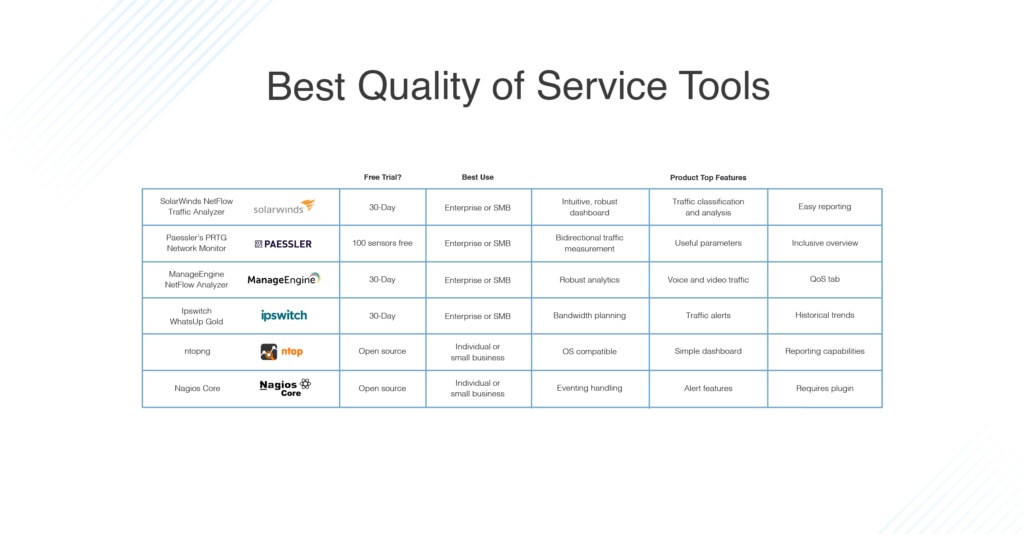
I’m a huge fan of NetFlow Traffic Analyzer from the team at SolarWinds. This comprehensive traffic monitoring platform captures data from network traffic streams and translates it into easy-to-digest charts and graphs, empowering system administrators with actionable information pertaining to their network health and performance. With NetFlow Traffic Analyzer, administrators can quickly discover traffic patterns, identify applications hogging the bandwidth, and gain clear visibility into traffic types, helping them spot corrupted traffic from cyberattackers more readily.
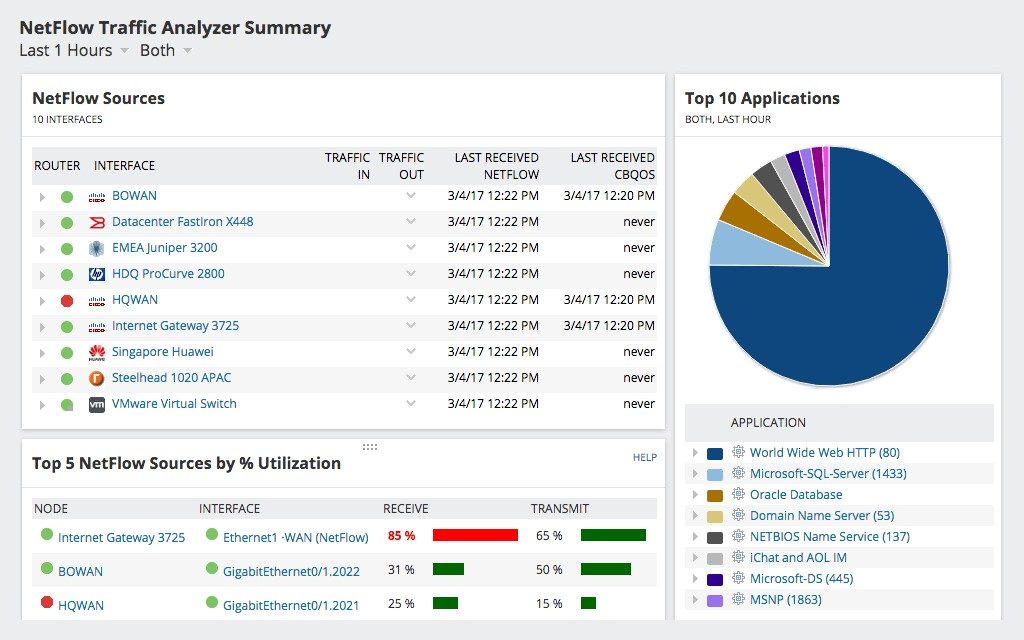
Specific to quality of service, the platform’s Network QoS Test allows IT technicians to manage their network traffic by class, including both Type of Service (ToS) and DSCP. This is critical for those seeking to analyze the success of their QoS policy and ensure all existing policies are performing effectively. For example, an admin may view the QoS reporting dashboard and determine delay-sensitive traffic isn’t receiving top priority, resulting in disjointed video conferencing or dropped phone calls. Having this information at hand will allow the administrator to more quickly remedy the issue and prevent it from reoccurring, boosting the end-user experience. NetFlow Traffic Analyzer is highly intuitive while still providing in-depth and highly valuable insights. I recommend giving the 30-day free trial a try.
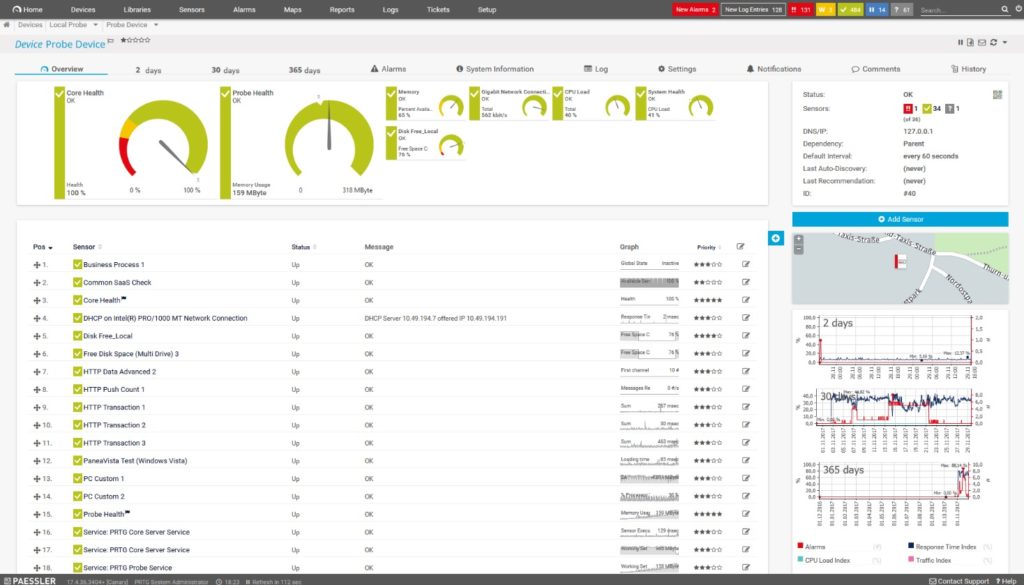
Paessler’s PRTG Network Monitor provides dedicated QoS sensors to monitor the performance of your QoS policies, Cisco IP SLAs, Cisco Class-Based QoS (CBQoS), and beyond. For example, the PRTG QoS Round Trip sensor monitors all VoIP-relevant network parameters by measuring traffic bidirectionally, meaning it tests the quality of your network between a probe and whatever device you’re targeting at the endpoint of the connection. In addition to VoIP parameters, PRTG QoS sensors can be enabled to measure parameters for jitter, packet loss, or delay.
Having access to this level of data helps IT technicians maintain their network performance and keep traffic flowing smoothly. Without it, it’s easy to become blind to the effectiveness (or lack thereof) of the QoS policies you have in place. QoS insights are also an integral element when it comes to evaluating the overall health of a company’s IT infrastructure. With PRTG, system administrators can glean an inclusive view of their network traffic, packets, applications, devices, bandwidth, IPs, and more, making this a great tool for those who are looking for a full suite of services. However, because the platform runs on a sensor-based licensing model, it’s easy for the price tag to become hefty, quickly.
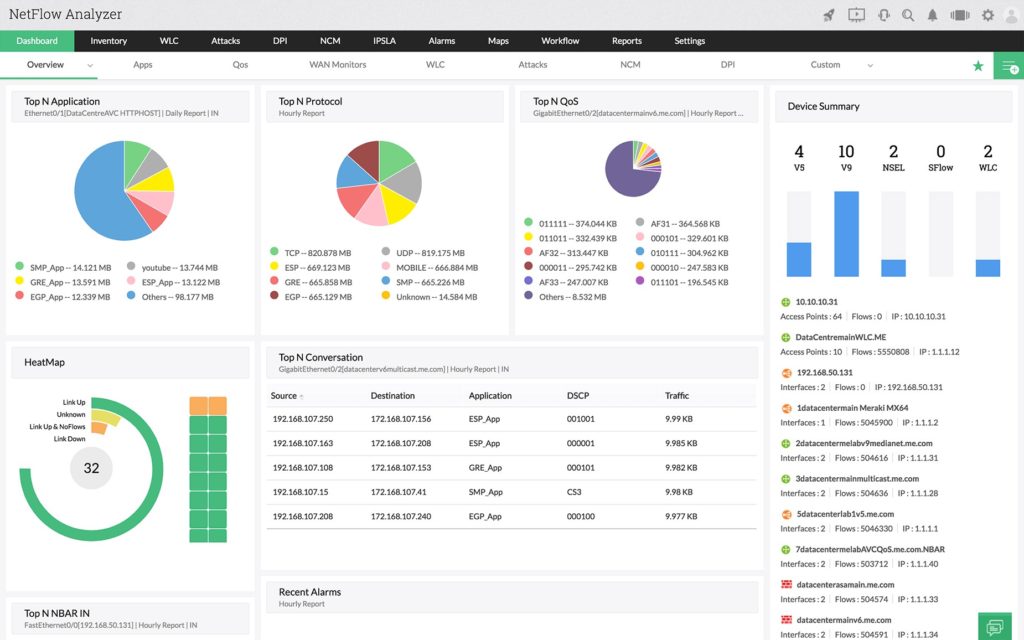
The NetFlow Analyzer from ManageEngine is a robust, dedicated traffic analytics tool reliant on flow technologies to monitor the bandwidth of a designated network. This software provides a wide array of network analytics empowering system admins to get into the weeds and review elaborate traffic patterns, device performance metrics, and highly granular bandwidth analytics. ManageEngine NetFlow Analyzer is also built with voice and video traffic data at top of mind—it’s equipped with an IP SLA monitor for analyzing IP service levels to helps IT technicians maintain consistent, high-quality voice and video communications.
From a bandwidth perspective, users can go to the QoS tab, where all QoS-specific information is housed. Within this tab, system administrators can view device specific QoS information and even determine which DSCP is handling the most traffic across devices. All this data helps IT technicians determine how effectively their bandwidth is being consumed and which policies and devices must be adjusted.
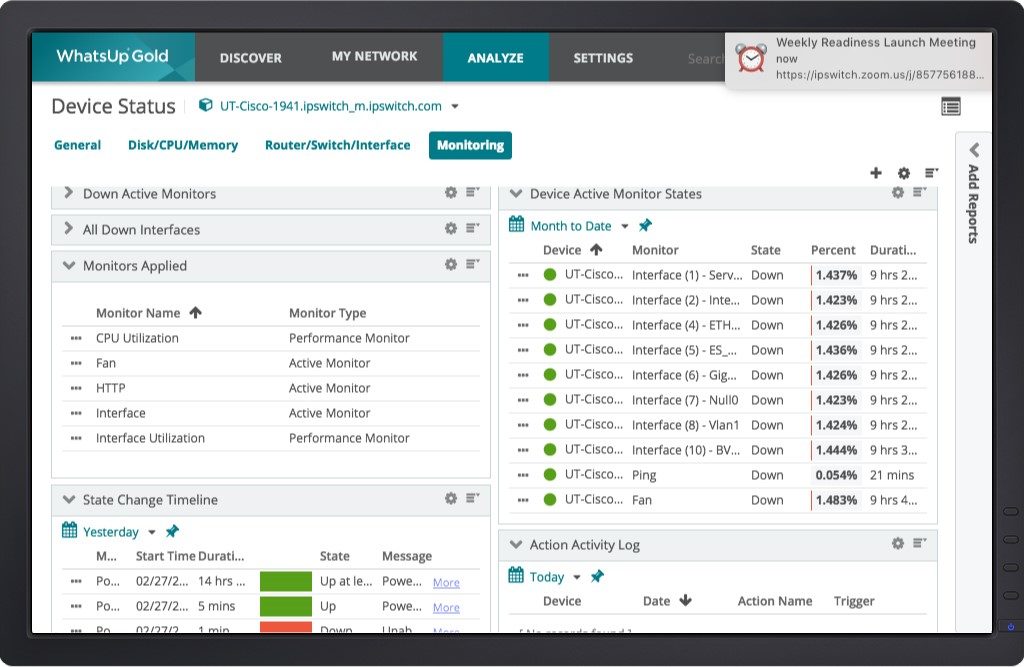
Ipswitch WhatsUp Gold is a great tool for system administrators looking to validate the effectiveness of their QoS plans by offering network flow-level traffic monitoring. With this platform, system administrators can easily detect whether they have prioritized their application traffic correctly to ensure an optimal end-user experience. WhatsUp Gold also puts bandwidth capacity planning front and center via a dashboard featuring historical usage trends, thus making it easy to detect which applications are hogging your bandwidth or when it may be time to bulk up your bandwidth. Bandwidth data can be gleaned from Cisco CBQoS and Network-Based Application Recognition (NBAR) as well as any flow-enabled device within a network.
To further facilitate this process, WhatsUp Gold keeps system administrators in the know through threshold-based traffic alerts. As soon as bandwidth thresholds have been crossed or unusual ports are in use, you’ll receive a notification. This helps not only improve the experience for end users, but also maintain the safety and security of your IT infrastructure.
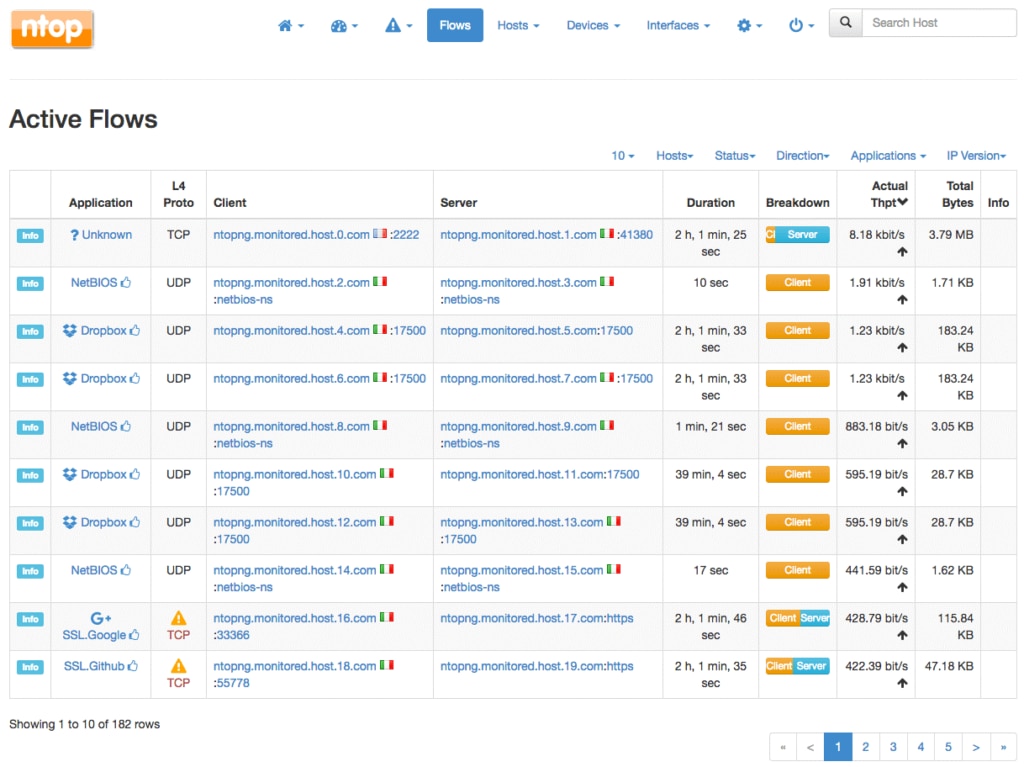
For smaller companies, those with limited budgets, or those who simply want the bare bones when it comes to network monitoring, there are a few free, open-source tools out there. One of the most popular is ntopng, which you may remember as ntop (the “ng” comes from “next generation”). The ntopng traffic probe provides both real-time and historical insight into their network traffic. The platform is based on libpcap and can run on nearly every Unix, Mac OS X, and Windows platform.
While it’s a simple and easy-to-use option, ntopng provides some actionable data, allowing users to sort network traffic by IP address, port, and throughput, and produce reports for network metrics, including application protocol. With the level of insight ntopng provides, system administrators can make more informed capacity and QoS planning decisions.
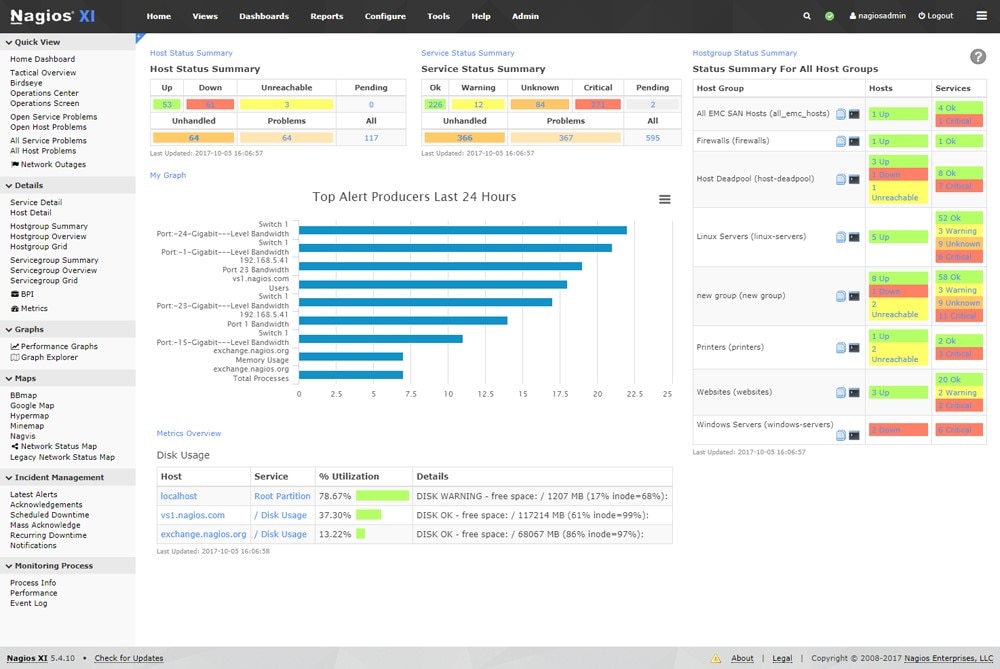
Like ntopng, Nagios Core is a free monitoring tool. In fact, it’s one of the most popular and well-known of the open-source options. Nagios Core is focused on check scheduling, execution, and processing as well as event handling and alerting.
If you decide to go this route, keep in mind Nagios requires a plugin to share any QoS-specific insights, including packet drop rates and other performance metrics. Not a huge detail, but it requires an extra step compared to some of the more intuitive, ready-to-run software options I’ve mentioned.
Getting Started With QoS in Networking
Merely having QoS policies in place isn’t enough—you need to know whether they’re operating effectively, meaning prioritizing traffic to boost the end-user experience and keep your company up and running, minimizing headaches for all parties involved.
There are many tools on the market capable of monitoring your QoS policies and helping you make more informed QoS planning decisions. My favorite? SolarWinds NetFlow Traffic Analyzer with its comprehensive and intuitive features. It’s also available for a 30-day free trial, so I recommend giving it a try to see if it’s the right fit for your team.
Related Posts
Top FREE Network Monitoring Tools
While I’ve included a few free network monitoring tools in this article, many more are out there. Check this list if you’re looking to avoid putting any spend behind a network monitoring platform.
Best Network Troubleshooting Tools
Figuring out exactly where a problem is occurring within your network and how to fix it can be a time-consuming endeavor, so I’ve pulled together this comprehensive list of troubleshooting tools.
Top FREE Server Monitoring Tools
Network performance is crucial, but it’s important to also consider the health of your server. This list details the best free server monitoring tools on the market so you can easily determine if it’s the network or the server at the root of your performance problems.
