

Windows Server is typically installed on heavy-use servers, which act as the backbone of many IT applications and services. If this is true of your organization, it’s critical to stay on top of Windows Server performance monitoring.
Finding a tool to act as a Windows Server performance monitor is vitally important, and choosing the right one can make a big difference in how stressful or difficult your performance monitoring process is. My recommendation is SolarWinds® Server & Application Monitor (SAM), a high-quality tool for flexible server monitoring offering integration through the Orion® Platform with other SolarWinds network and infrastructure performance monitoring software.
What Is Windows Server Performance Monitoring?
Windows Server Performance Monitoring Best Practices
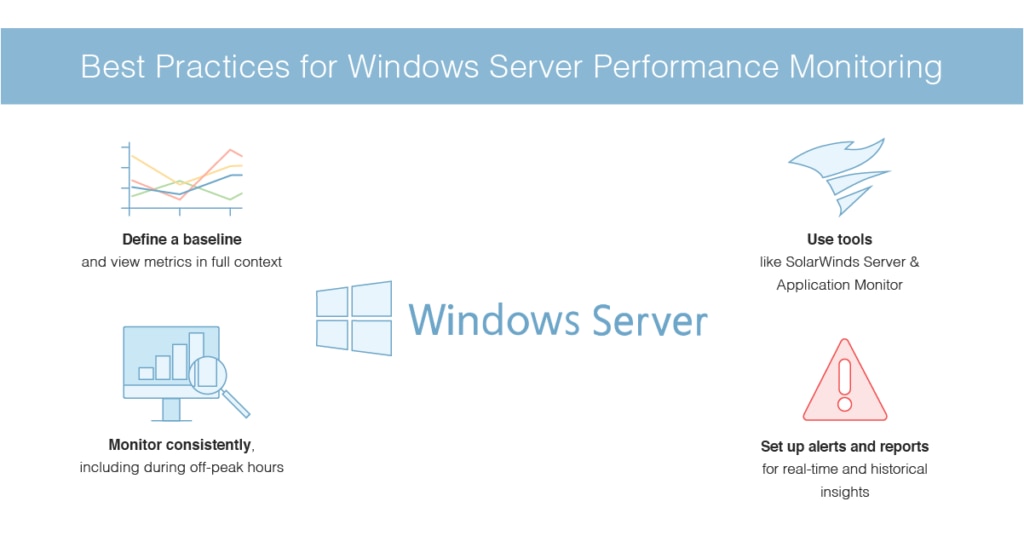
Define a Baseline
Monitor Consistently
Track Key Metrics
Use Tools
Set Up Alerts and Reports
Getting Started With Windows Server Monitoring
What Is Windows Server Performance Monitoring?
Windows Server performance monitoring refers to the range of processes involved in tracking the server’s key metrics, to ensure excellent performance. Windows Server includes some basic built-in tools for analysis and troubleshooting that let you monitor four key aspects of performance, including the server’s CPU, memory, hard disks, and the network interface card (NIC). You can examine various metrics related to these components to see whether the server is behaving as expected.
For example, even if the server appears to be performing well, with monitoring you might be able to see the CPU is already operating at 90% capacity. While the server is performing well now, if there’s a surge in demand, it will rapidly become overloaded.
Another important aspect of performance monitoring is to detect any anomalies in your network, or access attempts outside of what you expect. For example, if a malicious attacker is trying to infiltrate your network, you may be able to spot their attempts (and the resulting impacts on performance) thanks to comprehensive monitoring of your servers.
Windows Server Performance Monitoring Best Practices
I’ll go through some of my top tips for Windows Server monitoring best practices, to help you ensure your Windows Server monitoring approach is efficient, accurate, and useful for your wider network.
Define a Baseline
First, look at what normal performance is like for your servers. Without knowing what a typical day or week looks like, it becomes extremely difficult to spot any issues. In addition, make sure your baselines and measurements are approached from a “systems” level analysis, meaning you examine the whole system, not just one metric or component at a time. For example, CPU utilization might be high, but this doesn’t mean the CPU is automatically the problem: CPU utilization could be high because of a separate issue with the hard disks, or the memory, causing flow-on issues affecting the CPU. Baselines should be established to account for normal interactions between components and the system, not just individual metrics or components.
In addition, your baseline shouldn’t just be what typical performance looks like on its own: it should be ideal performance. Make sure you use your Windows Server performance monitor to ensure your entire system is optimized and working well (not just working at all) before you establish a baseline.
Monitor Consistently
Next, it’s important to ensure your Windows server performance monitoring is done consistently. If you only monitor sporadically, you can easily miss issues or not see a performance problem until it’s already too late. Monitoring processes should be set up to continually watch those key components and their metrics (including CPU, memory, hard disks, and the network interface card). You should also gather metrics on timing and usage for pages and queues, whether you have any server component health issues, and general user behavior and server access information.
While it might seem like business hours are the most important to monitor, it’s also useful to set a baseline for off-peak times. Some processes are set to occur during night time hours, and if you aren’t tracking server performance during those processes, you might miss critical issues.
Track Key Metrics
You should also be sure to monitor metrics relevant to Windows Server. By measuring specific performance statistics on an ongoing basis, it’s easier to see when and where measurements have changed significantly, so you can more easily pinpoint problems and start troubleshooting.
With a tool like SolarWinds Server & Application Monitor (SAM) you can monitor Windows Server metrics alongside a range of other server and application metrics. SAM provides over 250 out-of-the-box templates for monitoring servers and applications, which you can use as-is or customize as needed. With SAM, you can gain insight into key server performance measurements related to response time, packet loss, memory and disk capacity, hardware failures, and more.
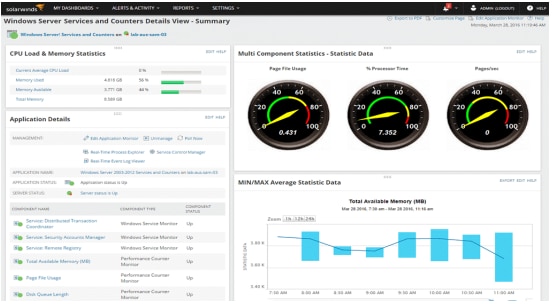
For instance, a SolarWinds template for Windows Server would include a range of component monitors, including:
- Services like Distributed Transaction Coordinator, Security Accounts Manager, and Remote Registry, and Server
- Metrics like memory, page file usage, % processor time, and disk queue length
Use Tools
As I noted above, using tools to monitor performance for your machines running Windows Server is important for being able to spot and troubleshoot problems. There are several different tools available for monitoring server performance. Some only check core metrics without allowing capacity planning or historic trends, while others are more comprehensive and offer broader network and application monitoring alongside the server performance. My recommended Windows server performance monitor tool, as mentioned above, is SolarWinds Server & Application Monitor, because it has high-quality features for Windows Server monitoring specifically, plus a wide range of other server and application monitoring tools.
First, SAM includes built-in forecast charts for capacity planning, so you can examine when your server resources will reach a threshold or could begin to experience issues. This is an important aspect of operating your Windows server performance monitor, as capacity planning and alerting can help mitigate and predict problems before they occur. In addition, you can also detect CPU utilization, memory issues, and disk space using SAM, so you can keep tabs on whether your core components are having issues.
SAM is also useful for baselining, as it includes historic information specifically for determining what normal resource consumption looks like. For Windows Server monitoring, you can also get information on load balancing, FTP, updates, remote desktop functioning, processor time, disk queue length, and page file usage, to gain a greater understanding of your Windows Server performance in a more systematic way.
With real-time troubleshooting tools, SAM also helps you quickly spot whether unusual processes or performance issues have arisen. This is a critical aspect of security monitoring, as mentioned, and I like how SAM can assist with both sides of this monitoring process.
Finally, SAM includes IT asset inventory scanning and discovery tools, which means you’ll know everything necessary about your hard drives, firmware, drivers, memory, processors, network interfaces, updates, software, and everything else you could possibly want to know about what’s happening in your IT environment. As I mentioned, setting baselines that consider the system as a whole is extremely important, and using SAM’s asset inventory scanning and monitoring tools can help give you a bigger-picture view of where performance issues might be coming from. You can try SAM free for up to 30 days.
Set Up Alerts and Reports
Finally, make sure you set up your systems to create automatic alerts and reports, so the relevant information can be provided for you, in real-time and historical views, when dealing with performance issues. Alerts on the previously mentioned metrics help ensure you don’t miss a potential issue by notifying you whenever a measurement exceeds the defined threshold. Reports can help you build a collection of historical data, which allows you to go back and see if the same problem is coming up repeatedly. In addition, regular reports can help you look back and see security issues or attempted intrusions you may have missed the first time. If you customize your reports to show only what’s most relevant to your organization or issue, you’ll also save time by avoiding information that isn’t useful for you.
Getting Started With Windows Server Monitoring
As you’re getting started with your Windows Server setup, you’ll want to choose a tool that can automate as much of the Windows Server performance monitoring as possible, as relying on manual monitoring simply isn’t feasible for most businesses. My top choice for Windows server performance monitor tools is SolarWinds Server & Application Monitor. With SAM you’ll have the features you need to implement best practices for performance monitoring, well beyond what’s possible with the built-in Windows Server tool.