It can be messy—and oftentimes overwhelming—when your log prints piles of errors or warnings. As you execute programs with front-end languages like JavaScript, your web console keeps log entries. You can access log entries from your web console with browsers such as Firefox, Google Chrome, etc.
Logging simply involves keeping track of all the changes you make in your program, taking note of your input, output, and the overall steps taken.
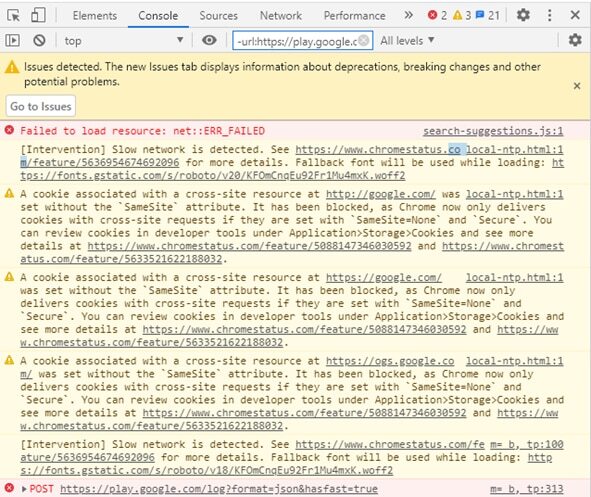
Therefore, it’s essential to search and filter useful logs, especially when others will maintain and review your code. Let’s say you just made a mind-blowing function in your application. You check your logs, and phew! There’s so much gibberish you aren’t interested in.
I’ve been in situations like this, and I’m currently in a situation like this. So how do I filter or search my logs? How can I get logs only concerning the functionality I just created?
Let’s look at the different methods I used for filtering and searching my JavaScript logs and how effective my results were.
Methods for Searching and Filtering JavaScript Logs
Searching and filtering logs are two different things. Whereas filtering helps you make a list of records matching a certain value by removing other records from the page, searching helps you find a match for your value by highlighting matches, not removing records that don’t match.
Whether we’re filtering our JavaScript logs for our web console to display only certain logs or searching them to highlight logs matching our criteria, we need to use effective methods to avoid filtering or searching the wrong data.
Let’s dive into the different methods and tools capable of helping us search and filter JavaScript logs. First, let’s look at searching methods.
Preparing Your JavaScript Logs for Searching
You’re probably already familiar with the console.log() function. You put it into your code and log out whatever is in the parentheses. We’ll look at some other built-in JavaScript logging functions and how we can search our logs with them.
console.warn()
When we try to search for something, the result highlights all data matching our criteria. If we have a simple JavaScript program, how do we make data we’re interested in stand out? The console.warn() function prints our log with a warning flag. This way, programs you attach this function to won’t display as an ordinary log message. Instead, messages will display as a warning.
console.warn("This may be an error");In your console panel, you’ll get notifications about warnings, errors, and issues with your program. We can add console.warn() to expressions in our code to highlight our logs or search our logs for warnings.
console.error()
Another very useful function to search logs is the console.error() function. Just like console.warn(), you can highlight the results of your JavaScript log as an error. The message you pass into the parentheses is printed out in red as an error.
For instance, we may want to catch an error by logging it in our console:
    // program to show catching and logging an error in console
    var a = 100;
    var b = 200;
    try {
        console.log(a + b);
        // forgot to define variable z
        console.log(z);
        } catch(error) {
             console.log('An error caught');
             console.log('Error message: ' + error);
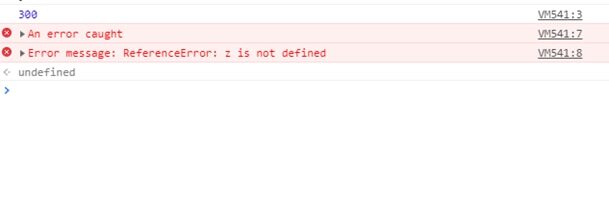
The expression above will log out the message in the console as illustrated in the image below:

But presenting the logs we’re looking for in the same way as other logs is what we’re trying to avoid. This isn’t an acceptable solution because the number of log messages will be overwhelming, making it difficult to identify the messages we need to pay attention to.
One potential solution is to repeat this program with console.error() instead of console.log() in the catch() function. This new program will print this in the console:
console.info()
The console.info() function is similar to console.log(), but the console.info() function is used to output logs’ info icon on the console. To do this, it adds an info icon close to the log message. Chrome and Safari may not display the info icon near the log message unless you use a dev tool like Chrome DevTools.
Style Logs With CSS
To make logs we’re interested in stand out from other logs, we can style our logs with CSS inside the console.log() parentheses like this:
console.log("%cAndre",

`font-size: 14px; color: green;`)
The expression above will print the log in a green color, as you can see in the image below. You can always add more styles to enhance the appearance of logs.

Ways to Filter JavaScript Logs
Now we’ve highlighted the logs matching our criteria using functions like console.log(), console.warn(), and console.info(). We can further filter our search by grouping console messages and other tools in our console. Below are a few different ways we can use JavaScript functions and console tools to filter our logs.
Console Tools
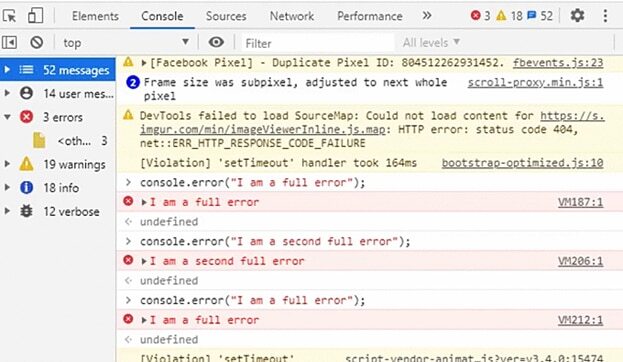
After we successfully highlight the logs in our console, we may quickly realize this step isn’t the solution to our problem. In other words, the pile of logs still shows up in our console, only this time the logs are a mixture of different colors. How, then, do we filter the logs to display only messages we’re interested in? Web browsers have excellent built-in tools to help you filter your logs to display logs matching your criteria. The GIF below shows how to filter logs and display error logs only.
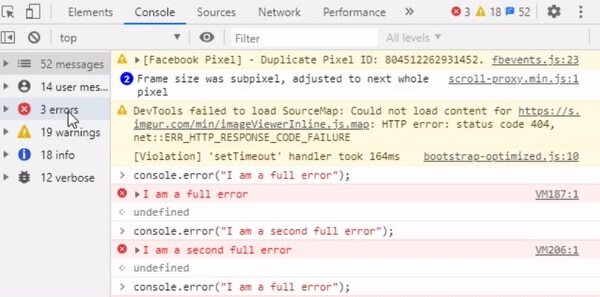
With the same steps shown below, we can also filter logs to show only warning, info, and verbose messages. We can also filter log messages according to the files and folders our log messages are coming from. The GIF below illustrates how to efficiently filter messages according to the location of the error.
What if we want to display log messages according to the different log levels? For instance, we may want to display debug messages on our console. When we click the verbose option, as shown in the GIF below, debug messages are displayed in our console.

console.group()
Let’s say we get lost or caught up in a pile of logs. How do we simplify the logs into collapsible groups? When we group our logs, they display in our console as a collapsible set of data. In addition, grouped messages appear together, making it easy to locate them.
The expression below shows how to group log messages:
console.group('Shopping Cart');
    console.log('user: John Doe');
    // Group Start
    console.group('Shopping item');
    console.log('Name: JS Book 1');
    console.log('Author: Unknown author');
    console.log('ISBN: 048665088X');
    console.groupEnd();
    // Group strat
    console.group('Shopping item');
    console.log('Name: JS Book 2');
    console.log('Author: Unknown author');
    console.log('ISBN: 048665087X');
    console.groupEnd();
    console.groupEnd();
In conclusion, use the console.group() command to display messages in the console as groups for easy accessibility.
Regex
Regular expression (regex or regexp) comes in handy when your logs are messy. You can use regex to filter right from the web console. The expression below shows how to filter with regex by enclosing an expression in two forward slashes //.
//This expression will show only logs with cookies in them
/cookies/
You can also filter out expressions by negating a specific word with regex. This is done by adding a minus sign (–) before the forward slash, as you can see in the expression below:
//This expression will show only logs that don't contain cookie
-/cookie/
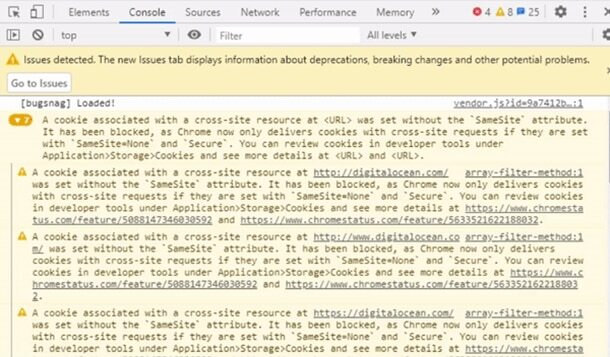
You can also use more complex regex expressions to filter words with spaces, characters, etc. In addition to using regular expressions, you can filter your logs by putting strings into the filter bar. The GIF below shows how to filter with regex and strings in Chrome’s filter bar.
array.filter()
What if you’re trying to filter a range of numbers or letters? Let’s say you want the console to log only certain numbers or strings according to the different parameters you put in. JavaScript’s array.filter() function filters the entry in an array and returns an output matching the filter input range.
The expression below shows an illustration of how to use array.filter() function to filter log results for numbers and strings, from simple usage to complex usage.
//Simple usage in filtering numbers
[10, 80, 5, 100, 19].filter((number)=> number < 20);

//Simple usage in filtering strings
["a", "f", "c", "d", "b", "g"].filter((char)=> char < "d");

//Advanced usage in filtering numbers
const numbers = [10, 9, 12, 8, 58, 156]

// Create a function to filter number array
const functionFilterNumbers = function(number){
	return number < 70;
}

// Filter the 'numbers' array with array.filter
const filtered = numbers.filter(functionFilterNumbers)

//Display filtered numbers instead of logging all numbers
console.log(filtered);

//Advanced usage in filtering strings
const names = ['Danny', 'Esther', 'Stanny', 'Fanni', 'Habip'];

// Filter the array for names having 'ann'
const nameFilter = names.filter(name => name.includes('ann'));

// Log array that match filter
console.log(nameFilter);
This method comes in handy when you want to filter your array to log out results matching certain elements from your array. Sometimes when your logs become intertwined and messy, you must employ the help of third-party software. The next section discusses third-party tools capable of helping you search and filter JavaScript logs.
How to Achieve Next-Level Searching and Filtering
We’ve seen the different methods we can use to filter and search our JavaScript logs. These steps are useful, but it can also get better. Logging comes with the challenge of analysis. How do you analyze logs, get real-time alerts and charts, and reduce anomalies stress-free?
SolarWinds® Papertrail™ helps you analyze and improve logging for server-side JavaScript applications like those built with Node.js. You can integrate this tool with Heroku to monitor and analyze your hosted application.
Searching and filtering logs is a skill with which we all need to get familiar. If, like me, you want to get in-depth knowledge about centralized logging from JavaScript, this documentation is a good fit for you.


