Every event on your network is recorded as a log. Because logs use a standard data format, you can easily search and analyze them to troubleshoot problems or catch security issues.
If you efficiently manage your Windows Server logs, you can help your business with profiling, auditing, and creating statistics for growth. It’s possible to manually view, search, and manage logs in Windows Server, but as the amount of logging data increases, especially in big networks, using a third-party Windows Server log management tool is a better approach. My top choice for this task is SolarWinds® Log Analyzer, as it’s easy to use, comprehensive, and can help you manage large volumes of logs in an enterprise setting.
- How to Check Windows Server Logs
- Efficiently Using Windows Server Log Management Tools
- Key Considerations for Windows Server Logs

How to Check Windows Server Logs
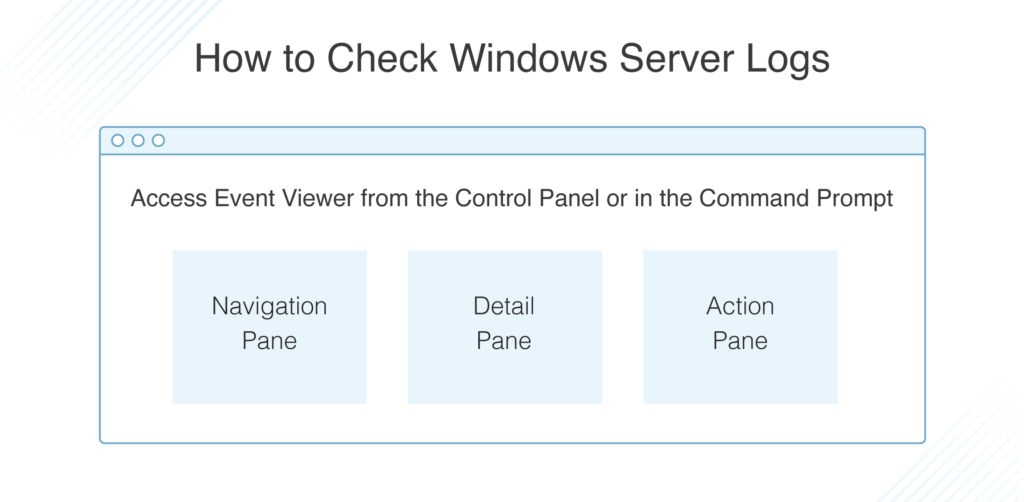
Event Viewer is the native Windows tool for managing Windows logs. Using Event Viewer, you can navigate through logs, filter them by type, and export them for further analysis. Event Viewer can be easily accessed in several ways, such as from the Control Panel or by opening the command prompt and typing “eventvwr.”
The Event Viewer interface is divided into three sections: the Navigation Pane, the Detail Pane, and the Action Pane.
The Navigation Pane is where you can select the type of log you want to view. There are five categories of Windows Server logs: Application, Security, System, Setup, and Forwarded Events. The first three categories are the ones you’ll use the most, as they contain detailed information on security breaches, system failures, and detailed data about the applications running on your network.
In the Detail Pane, the Overview tab displays a chronological list of logs by default, but each column header allows you to sort the events by other criteria. Windows Server logs can be sorted by level of severity. Clicking on an event will display its information in detail in a new window, and the detail tab will show the event raw data. You can also switch between friendly view and XML view to look at further (or less detailed) information. By right-clicking on the event, you can also copy and paste the results into a text editor. The Summary tab of the Detail Pane displays totals by type of event over a week and a chronology of viewed nodes and major properties for each log file.
The Action Pane allows access to quick actions such as filtering, clearing, and exporting for the event currently selected, and is divided between actions available for the Navigation Pane selection and those available for the Detail Pane.
In addition, Event Viewer allows you to easily create custom views for Windows Server logs, to monitor certain types of logs or severity levels, and even send alerts when those events appear.
Efficiently Using Windows Server Logs Management Tools
Even when using the built-in Windows Server tools at their best, log management can become very complex, especially in big networks. Searching through logs manually when a high severity event is happening in your system can be stressful, and, more importantly, not fast enough. Without efficient and effective tools designed to handle large numbers of logs, you could miss important security issues or end up with an outage majorly affecting your end users.
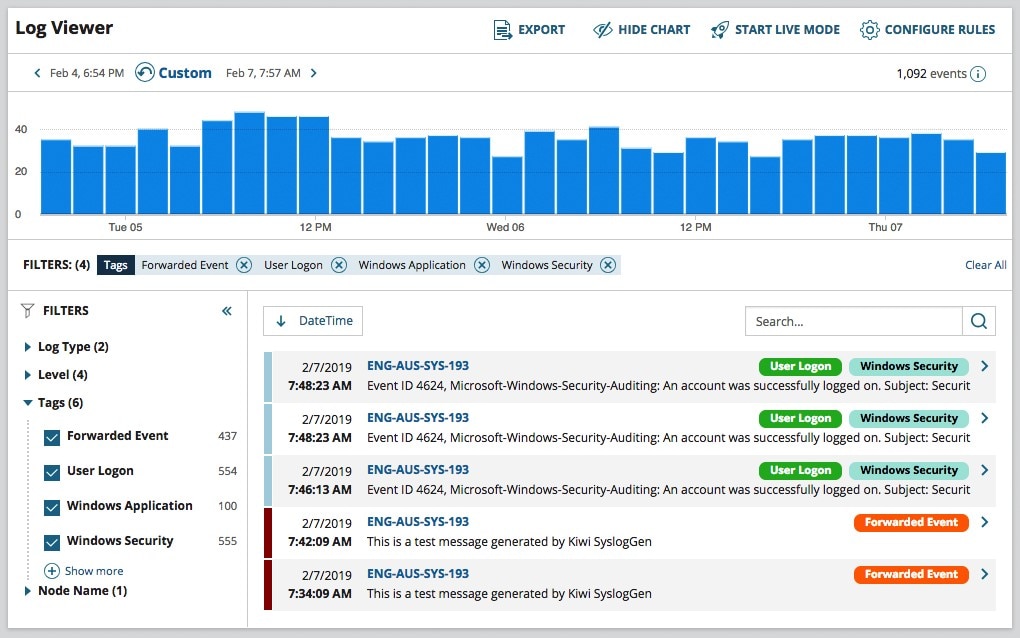
The solution is to use a log analyzer or log management software to save time, increase accuracy, and reduce the likelihood of your IT staff needing to quickly handle high amounts of data. Many tools can also help by centralizing Windows Server logs management from different sources. For effective log management tools, my top choice is SolarWinds Log Analyzer. This Windows Server log analyzer is designed as a powerful all-in-one management tool built to significantly reduce “log noise” while keeping constant, real-time monitoring running.

In addition, it aggregates and consolidates your logs in one place, making them easy to access and search through with a big-picture approach. The search tool also allows you to use smart tags and filters to finely tune the monitoring and make it easy to identify issues. The user-friendly UI includes an interactive chart to quickly visualize search results, volume, and timeframes while sorting through logs, so you can rapidly pinpoint the problem. If you want to try it out to see if it’s the right tool for you, a 30-day free trial is available.
Of course, Log Analyzer isn’t the only option in the market—Graylog or Datadog are also Windows Server log management alternatives. Like Log Analyzer, they both offer smart search tools and a user-friendly UI with charts and dashboards. An interesting feature in Graylog is the possibility to scale and combine searches to achieve more complex filtering. On the other hand, Datadog implements machine learning for smarter alerts and offers advanced archiving features. Both are good options you can test out to see if they’re a good fit for your business needs.
Key Considerations
By monitoring and managing your Windows server logs correctly, the event data produced by your network can be incredibly useful for troubleshooting and gaining insights into your business and how your network runs. Although some log management can be performed manually in Windows Event Viewer, a centralized management tool becomes vital for big networks to help ensure your business runs smoothly and issues are addressed efficiently. For this purpose, software such as SolarWinds Log Analyzer is the best solution.


