In cloud-native environments, observability is key to ensuring the health, performance, and stability of distributed systems. Observability helps developers and operations teams understand how their systems behave in real time, helping diagnose issues, optimize performance, and meet service-level agreements. OpenTelemetry, a popular open-source observability framework, has emerged as a leading solution to collect, process, and export telemetry data—logs, metrics, and traces—from cloud-native applications.
Monitoring and observability tools for OpenTelemetry
1. SolarWinds® Observability (free trial)
OpenTelemetry integrations (apps and services)
In this guide, we’ll dive deep into OpenTelemetry, covering its architecture, components, benefits, and how to get started using it to instrument your applications for observability.
What is OpenTelemetry?
OpenTelemetry, also known as OTel, is an open-source observability framework. It allows you to collect, process, and export telemetry data—including metrics, logs, and traces—from your applications and infrastructure. It’s an evolution of two prominent projects: OpenTracing and OpenCensus. Initially designed to provide tools for distributed tracing, these efforts have since unified under the Cloud Native Computing Foundation, ultimately leading to the formation of OpenTelemetry.
Therefore, OpenTelemetry’s primary goal is to establish a unified standard, which developers can leverage to instrument their applications. This eliminates the redundancy of instrumenting applications multiple times for various observability platforms. Consequently, this approach enables developers and operators to gain deeper insights into their systems, pinpoint bottlenecks more effectively, and ultimately enhance overall system reliability.
How OpenTelemetry works
OpenTelemetry operates by instrumenting applications with code, which captures telemetry data such as traces, metrics, and logs. It then processes the data and exports it to a designated back end, letting you visualize and analyze it effectively. The main components of OpenTelemetry include the following:
- Instrumentation libraries: These capture telemetry data and are integrated into the application code. They’re available in several languages, including Java, Python, Go, JavaScript, and more.
- Collectors: The OpenTelemetry Collector is an optional but highly useful component. It serves as an intermediary between instrumented applications and the back-end observability platform. It can receive telemetry data from multiple sources, perform processing, and export it to one or more back ends.
- Software development kits (SDKs): OpenTelemetry provides SDKs for several programming languages, allowing developers to configure and customize how telemetry data is collected and exported.
- Exporters: These send telemetry data to the chosen observability platform. OpenTelemetry supports many back ends out of the box, including Prometheus, Jaeger, Zipkin, and third-party vendors, such as SolarWinds, Datadog, and New Relic.
- Context propagation: OpenTelemetry uses context propagation to ensure telemetry data—for example, trace identifiers—is passed along different components of a distributed system, enabling comprehensive monitoring of requests as they move through the system.
OTel collectors
The OpenTelemetry Collector is a crucial component of the observability framework. It’s responsible for receiving telemetry data, processing it, and exporting it to various back ends. The collector can be deployed in the following ways:
- As an agent: The collector is deployed alongside applications to collect telemetry data locally and export it to a central location.
- As a gateway: The collector acts as a centralized service, receiving data from multiple sources and forwarding it to observability back ends.
The collector supports various data processing capabilities, including:
- Filtering: The collector discards irrelevant data based on predefined criteria.
- Aggregation: The collector combines data points for more efficient storage and analysis.
- Enrichment: The collector adds additional metadata to the telemetry data before exporting it.
Use cases for OpenTelemetry
OpenTelemetry can be employed in various scenarios across industries to enhance the observability of cloud-native systems. Here are a few primary use cases:
- Distributed tracing: OpenTelemetry provides detailed traces of requests and transactions across multiple services in a distributed architecture. This is vital for pinpointing bottlenecks, errors, and latency issues.
- Application performance monitoring (APM): OpenTelemetry enables organizations to monitor the performance of their applications and services in real time by collecting metrics and traces.
- Logging and event monitoring: Logs from various services can be correlated with traces and metrics to provide a comprehensive view of an application’s behavior.
- Error and exception tracking: OpenTelemetry can track errors and exceptions, providing insights into system health and reliability by correlating these issues with the associated traces and logs.
- Security monitoring: OpenTelemetry is primarily used for performance monitoring, but you can also configure it to track security-related telemetry data, which ultimately aids in the detection of suspicious behavior.
Key benefits of OpenTelemetry
- Vendor-neutral: OpenTelemetry is compatible with several observability back ends, making it easier for organizations to switch vendors or use multiple observability tools.
- Standardization: OpenTelemetry standardizes the collection of telemetry data across languages, platforms, and services, ensuring the same observability practices can be applied universally.
- Flexibility: OpenTelemetry supports customizable instrumentation and processing of telemetry data, enabling teams to tailor the observability setup to their specific needs.
- Extensibility: OpenTelemetry can be extended by adding custom instrumentation and exporters to fit unique use cases.
- Community driven: OpenTelemetry is actively maintained by a large community as an open-source project, ensuring continuous improvements and support for new technologies.
Telemetry metrics
Telemetry data allows developers and DevOps teams to monitor applications, detect issues, optimize performance, and gain visibility into their distributed services. OpenTelemetry collects three primary types of telemetry data: metrics, traces, and logs. This post dives into the various telemetry metrics and types of telemetry data OpenTelemetry uses to provide a complete observability solution.
Types of telemetry data used by OpenTelemetry
OpenTelemetry collects three key types of telemetry data to create a comprehensive observability solution: traces, metrics, and logs.
- Traces: Traces represent the end-to-end flow of requests through an application. They record the path taken by a request as it travels through various services and components. Each step within a trace is called a span, and spans contain details about the operation’s duration, status, and relationships to other spans. Traces are invaluable for understanding how requests flow through a system and in diagnosing performance bottlenecks, latency issues, and dependencies between services.
- Metrics: Metrics are numerical measurements, providing information about a system’s performance and health over time. They are aggregated and can be used to track trends, set thresholds, and generate alerts. Metrics are valuable for understanding resource utilization, throughput, error rates, and overall system behavior.
- Logs: Logs are time-stamped records of events within an application or system. They provide detailed information about what happened at specific points in time and help to debug and troubleshoot. Logs capture individual events, errors, and messages, often providing context to traces and metrics for understanding system issues in detail.
Monitoring and observability tools for OpenTelemetry
When working with OpenTelemetry, selecting the right monitoring and observability tools is essential to ensure seamless visibility across your entire system. Various platforms provide different levels of integration, automation, and insights, helping organizations manage complex environments and optimize performance. Below are some popular tools to enhance OpenTelemetry’s capabilities in effectively monitoring and observing applications.
1. SolarWinds® Observability (free trial)

© 2024 SolarWinds Worldwide, LLC. All rights reserved.
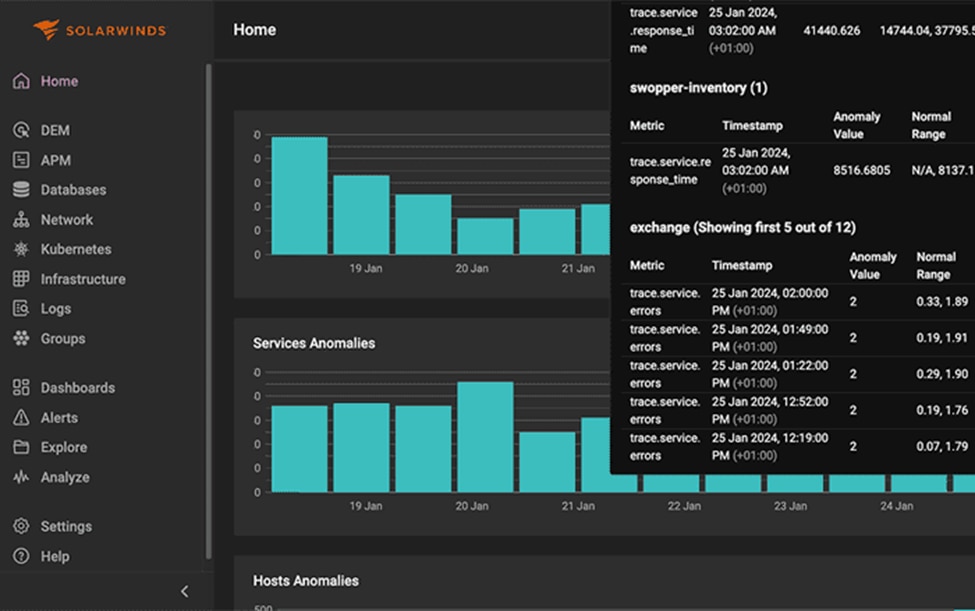
SolarWinds provides a comprehensive observability solution. It integrates with OpenTelemetry to monitor and analyze application performance across hybrid, self-hosted, and multi-cloud environments.
Pros
- Automatic discovery: Quickly detects and maps services and dependencies
- Real-time monitoring: Offers immediate visibility into application performance, user experience, and infrastructure health
- Integrated APM: Provides robust application performance management capabilities
- Root cause analysis: Provides effective tools for diagnosing issues through detailed traces and logs
- Custom dashboards: Grants flexibility to create dashboards tailored to specific metrics and data
Cons
- Configuration: Can be complex, requiring considerable time to fine-tune in the initial setup
- Cost: Can be high, particularly for smaller teams or startups
2. Datadog

© Datadog 2024
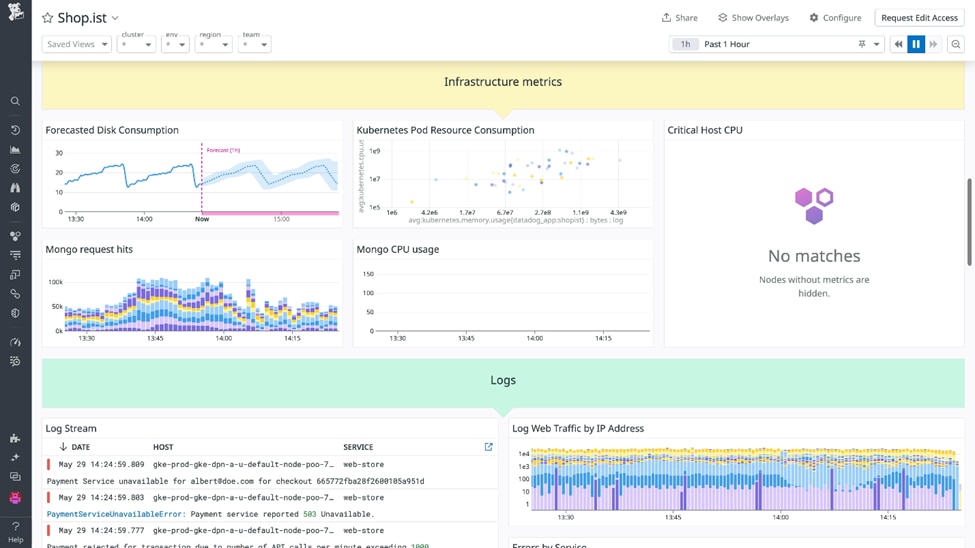
Datadog is a popular cloud monitoring and observability platform, supporting OpenTelemetry for seamless integration and enhanced observability across various services.
Pros
- Unified data: Combines metrics, traces, and logs for comprehensive monitoring in one platform
- Out-of-the-box integrations: Easy to set up through its extensive integrations with cloud providers and tools
- Distributed tracing: Provides valuable insights into request traces and identifies bottlenecks in microservices
- Dashboards and alerts: Offers customizable dashboards and proactive alerting capabilities
- Machine learning: Utilizes machine learning to detect anomalies and predict performance issues
Cons
- Learning curve: The platform may initially be complex to navigate.
- Cost: It can become expensive as you scale and add more features or integrations.
3. Dynatrace

© 2024 Dynatrace LLC. All rights reserved.
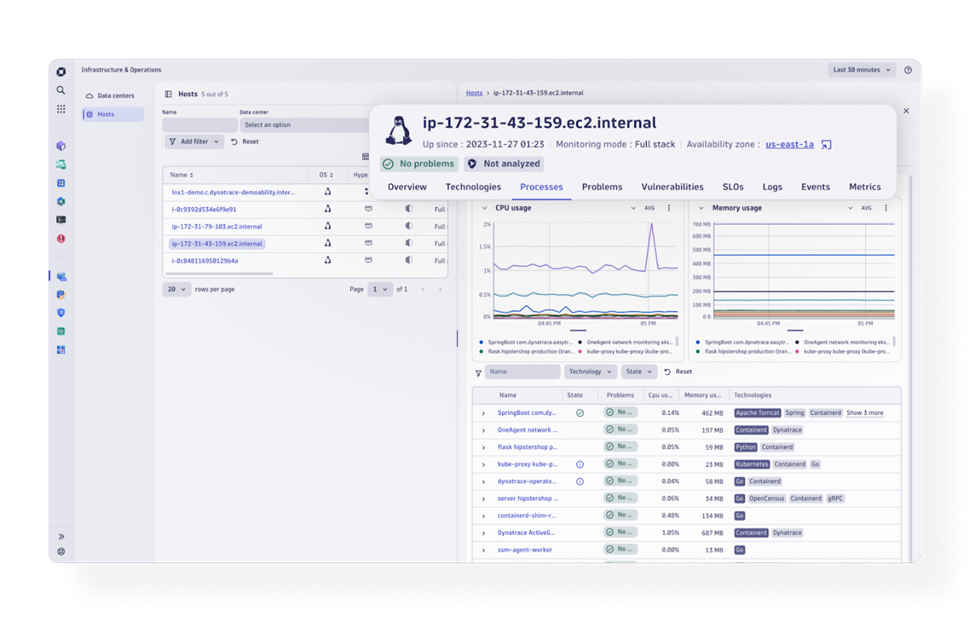
Dynatrace offers an AI-powered observability platform, which integrates with OpenTelemetry to provide deep insights into application and infrastructure performance.
Pros
- Smartscape technology: Visualizes dependencies and interactions in real time
- Full-stack monitoring: Comprehensive monitoring of applications, user experiences, and infrastructure
- AI-powered analytics: Automated root cause analysis and performance insights powered by AI
- Auto-discovery and instrumentation: Simplifies data collection with minimal manual setup
- Customizable dashboards: Allows for tailored visualization of the data you need most
Cons
- Pricing: Can be pricey, especially for small to midsize businesses
- Overwhelming features: Breadth of features may overwhelm teams with limited resources
4. New Relic

© 2008–24 New Relic, Inc. All rights reserved.
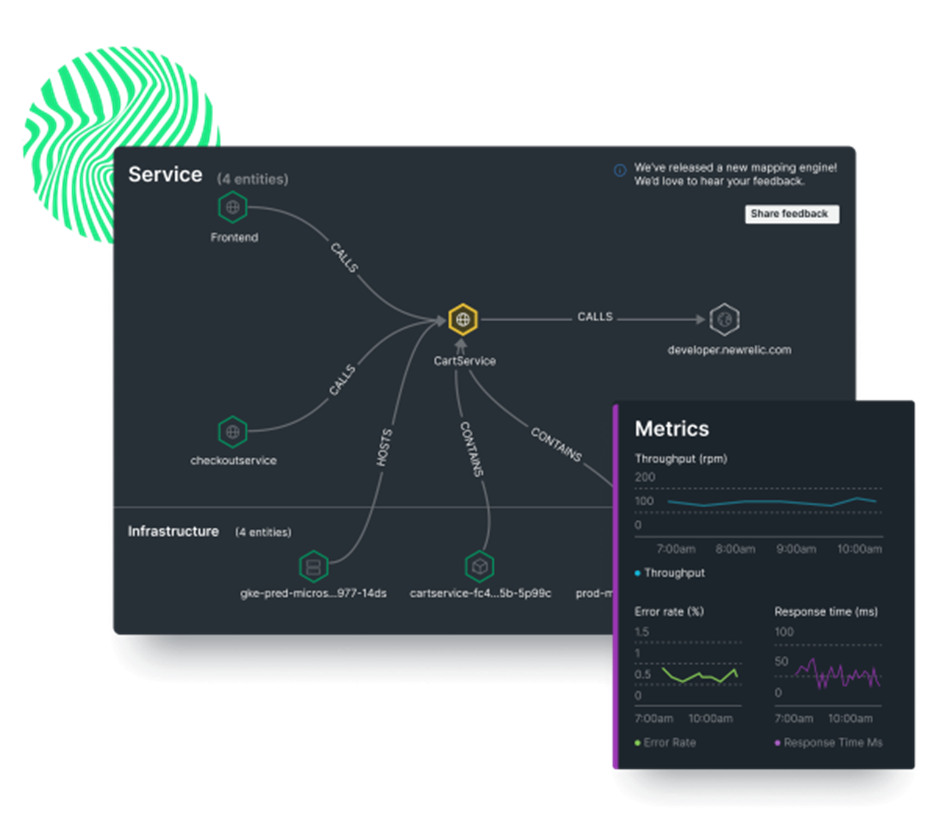
Helping organizations monitor their entire stack, New Relic is a leading observability platform. It integrates with OpenTelemetry for enhanced observability.
Pros
- Full-stack observability: Provides insights into applications, infrastructure, and customer experience through a unified platform
- Distributed tracing: Effectively tracks requests across microservices
- Error analytics: Detailed error tracking and analysis improve application reliability
- Custom instrumentation: Supports deep integration with OpenTelemetry for tailored monitoring
- Alerts and dashboards: Easy to set up alerts and customize dashboards for visibility
Cons
- User interface (UI): Some users may find the UI to be less intuitive compared to competitors.
- Performance impact: Certain configurations may introduce some performance overhead on monitored applications.
Challenges of OpenTelemetry
OpenTelemetry offers significant benefits for observability, but it comes with challenges. Organizations and developers need to address the following:
- Complex setup and configuration: Ensuring compatibility across services and environments demands significant time and effort. OpenTelemetry’s various components, such as collectors and instrumentation libraries, can be difficult to configure.
- Overhead and performance: Instrumenting applications adds extra CPU, memory, and bandwidth usage, which may impact performance, particularly in high-throughput systems.
- Consistency across services: Maintaining consistent instrumentation across microservices written in different languages in distributed systems makes it hard to ensure uniform data for metrics, traces, and logs.
- Data storage and costs: Filtering or aggregating data to manage expenses is necessary for organizations to strategize, as the large volume of telemetry data generated can lead to high storage costs.
- Legacy system compatibility: Integrating OpenTelemetry with legacy or closed-source systems can be complex and often requires custom development.
- Vendor lock-in risks: Despite aiming for vendor neutrality, some telemetry components may still tie users to specific platforms. As a result, this can lead to potential lock-in.
- Monitoring overload: Developing effective dashboards and alerts is crucial, as the abundance of data can overwhelm teams if not properly filtered and visualized.
OpenTelemetry integrations (apps and services)
OpenTelemetry integrates with a wide range of applications, services, and libraries. Some notable integrations include the following:
- Web frameworks: OpenTelemetry integrates with popular frameworks, such as Flask, Django, Express.js, and Spring Boot, to provide automatic instrumentation.
- Messaging systems: OpenTelemetry can instrument messaging systems, such as Apache Kafka, RabbitMQ, and AWS SQS, which enables distributed tracing.
- Databases: Integration with databases, such as MySQL, PostgreSQL, MongoDB, and Redis, enables you to collect database query performance metrics.
- Cloud services: OpenTelemetry offers support for cloud environments, including AWS, Azure, and Google Cloud, for monitoring cloud-native applications.
- HTTP libraries: OpenTelemetry offers instrumentation for HTTP client libraries, providing insights into network request timings and status codes.
OpenTelemetry best practices
To make the most out of OpenTelemetry, consider the following best practices:
- Start with sampling: Set up a plan to control how much telemetry data you collect. This helps reduce the amount of data, especially in large systems.
- Use automatic instrumentation where possible: Leverage automatic instrumentation for common libraries and frameworks to minimize manual effort and ensure consistency.
- Define consistent naming conventions: Use consistent naming conventions for traces, spans, and metrics to make it easier to correlate telemetry data across different systems.
- Monitor collector performance: Keep an eye on the performance of OpenTelemetry collectors, as they may become a bottleneck if overwhelmed by incoming data. Consider using horizontal scaling to distribute the load.
- Integrate with existing monitoring tools: Leverage OpenTelemetry’s integrations with observability platforms to gain a comprehensive view of your system’s health.
- Resource metadata: Attach relevant resource metadata to all telemetry data to provide context about its origin—for example, its service name and environment—as this helps when analyzing data across multiple services.
- Set up alerts and dashboards: Use the telemetry data collected by OpenTelemetry to create custom dashboards and alerts. This helps you proactively address potential issues before they affect users.
- Regularly review instrumentation: Ensure your instrumentation keeps up with changes as your application evolves. Remove outdated instrumentation and add new instrumentation where needed to maintain observability coverage.
Conclusion
As cloud-native applications become more complex, using OpenTelemetry will not only be important for keeping systems healthy and running well, but it will also be necessary for meeting the needs of modern distributed systems. OpenTelemetry provides a standard way to track what’s happening in an application, helping developers and operators see how it works, fix issues faster, and boost performance. Using this tool improves visibility across different environments and promotes collaboration. In the end, this teamwork will lead to stronger, more scalable applications.
This post was written by Wisdom Ekpotu. Wisdom is a software and technical writer based in Nigeria. Wisdom is passionate about web/mobile technologies, open source, and building communities. He also helps companies improve the quality of their technical documentation.


