Businesses typically rely on network storage setups, in the form of either network attached storage (NAS) or a storage area network (SAN). These can be harder to manage and monitor than simpler storage infrastructures. In many cases, especially for larger businesses, storage performance monitoring software is a must. In this article, I’ll focus on SANs. I will discuss how they work, the importance of monitoring SAN performance, and my picks for SAN storage monitoring software.
SAN vs. NAS
What is SAN Performance Monitoring?
Best Storage Performance Monitoring Tools
Benefits of Storage Management Tools
SAN vs. NAS
Most businesses use networked storage solutions, which come in two forms:
- Network-attached storage (NAS)
- Storage area network (SAN)
NAS usually involves a hardware device connected through a local area network (LAN). In contrast, SANs use fiber connections to link up many storage devices, so each device can share its data with other devices.
A SAN is a high-speed storage network that allows storage traffic to move separately from the rest of the traffic on the LAN, which helps improve performance and keep network availability high. The purpose of a SAN is to increase efficiency, which it does by consolidating storage in one place instead of leaving it spread out throughout the network. Because each storage device is connected in a single network, it appears to users each storage device is accessed locally.
A SAN system allocates “logical unit numbers,” or LUNs, to each subsection of a storage device. This helps keep track of how storage is organized and allocated. A LUN could represent one storage disk or be allocated to a group of disks, called a “redundant array of independent disks,” also known as RAID. RAIDs keep copies of data, so if one device goes down, you have backups on all the other devices.
While NAS is less expensive and easier to set up, SAN systems are much higher-performing due to the use of fiber channels, and as such are frequently used in large businesses and administered by an IT professional. For large companies, quick file access is key, as is the ability to relieve pressure from the LAN. In addition, a SAN is easily expanded and can be virtualized, which allows the network to scale quickly as the enterprise grows.
What is SAN Performance Monitoring?
Managing and monitoring SAN performance is supremely important in an enterprise setting, as without carefully tracked SAN metrics, you could be losing out on the efficiency and performance gains mentioned above. SAN storage management software helps you track key metrics like latency, over-subscription, and RAID allocation to ensure your SAN is functioning properly.
- Latency: Changes in latency and slowdowns can indicate storage drives are failing. With a monitoring and management tool, you can manage bandwidth to and from storage devices to prevent bottlenecks.
- Over-subscription: One commonly used storage practice is called “thin provisioning,” or “over-subscription,” which entails reporting more virtual storage than the actual physical storage has. This can help improve network and infrastructure capacity and performance when managed correctly. Storage capacity management tools help you to mitigate the risk over-subscription brings.
- RAID allocation: With enterprise storage setups containing potentially thousands of LUNs, SAN storage management software is key to effective allocation, organization, and reporting. A good tool will ensure both LUNs and RAIDs are properly provisioned, in a configuration lending itself to efficient storage management.
Best Storage Performance Monitoring Tools
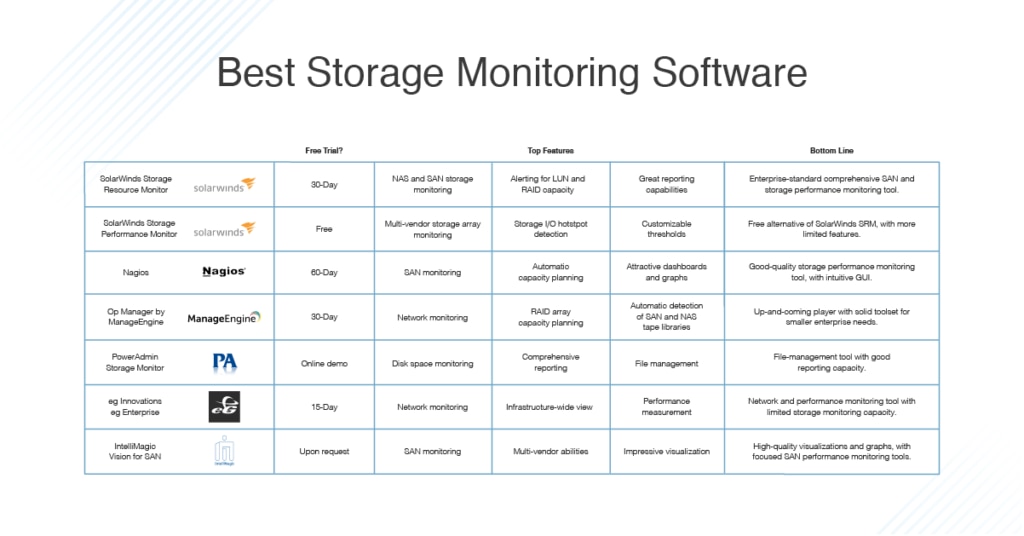
When looking at storage monitoring tools, free options may seem like a good deal. However, considering the essential role storage plays in an enterprise, it’s important to look at the best tools, not just the cheapest ones. I’ve rounded up the best storage monitoring software on the market. Most offer free trials, and I encourage you to test them out before making an investment.
SolarWinds® Storage Resource Monitor (SRM) offers real-time SAN and NAS storage monitoring on devices from multiple vendors, including NetApp, Hitachi, Dell EMC, HP, Huawei, and IBM. This multi-vendor capability is a big advantage: instead of using, for example, separate IBM and EMC storage monitoring tools, you can gain a detailed, unified view of all your storage metrics, including LUNs, RAIDs, and storage arrays, for all your devices.
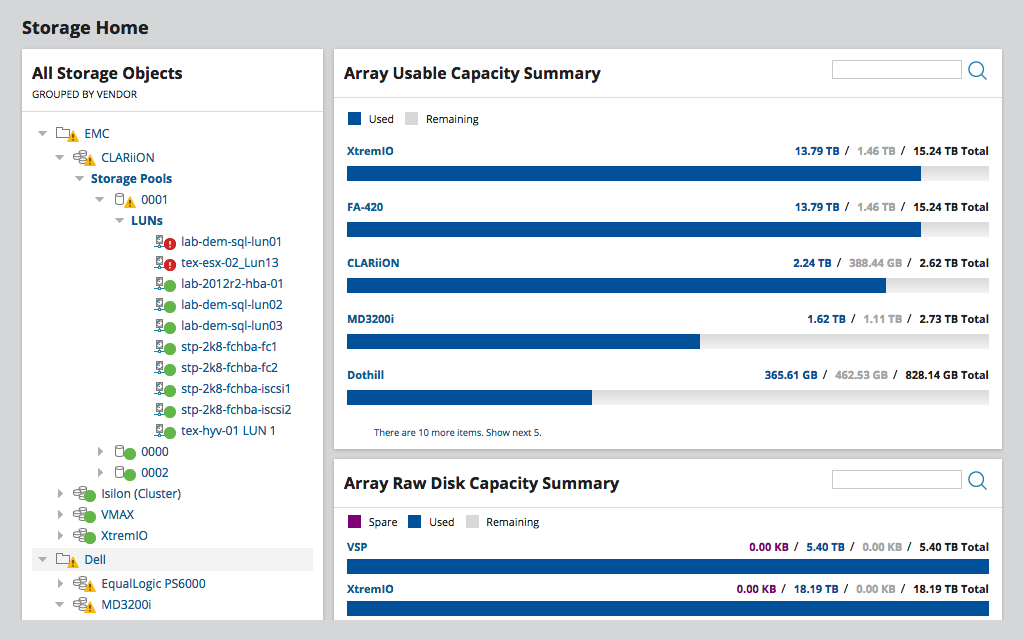
In terms of its use as a SAN monitor, SRM sends alerts for overloaded LUNs or RAID groups, and shows you space consumption on storage arrays. These features can help you to identify capacity issues before they become major performance problems. In addition, the full application stack view allows you to see this performance at every level, including virtual storage and applications. This allows you to pinpoint and troubleshoot problems throughout your infrastructure, rather than having to search layer by layer. You can try SolarWinds SRM free for up to 30 days.
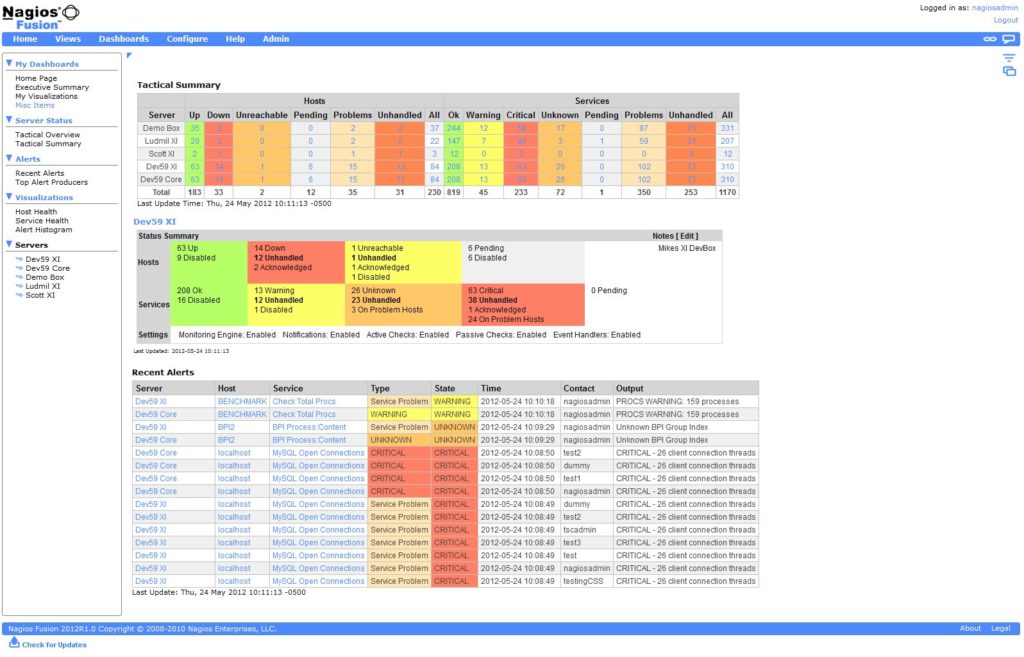
Nagios provides high-quality monitoring for SAN setups and infrastructure, looking at the capacity of your disks and directories, RAID status, and so on. It comes in two versions to help you manage and monitor your SAN setup: Nagios XI and Nagios Core. These general-purpose monitoring tools include SAN performance software, as opposed to standalone SAN storage monitoring tools. Nagios Core is the free offering, while Nagios XI is the enterprise-standard performance monitoring tool.
Nagios XI includes network and infrastructure monitoring for applications, services, and other system metrics, as well as automatic capacity planning for storage infrastructure. As a SAN monitor it allows you to track performance, so you can fix any storage problems before they affect your end users.
One of the best features of Nagios is its user-friendly and attractive dashboards and graphs. However, it’s limited in the depth of information it can provide on storage infrastructure compared to dedicated storage monitoring tools.
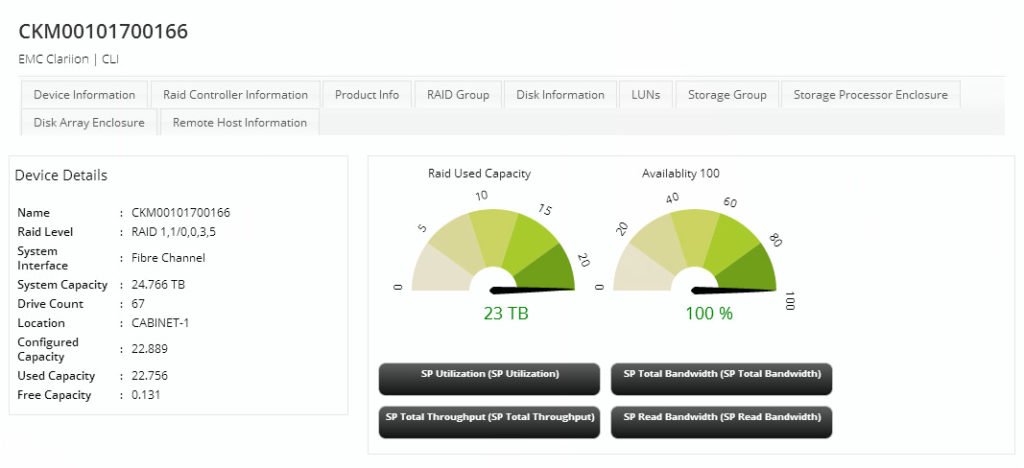
ManageEngine OpManager integrates the features of an older tool, OpStor. OpStor used to be ManageEngine’s offering for managing storage devices, including host servers, bus adapter cards, storage arrays, and fabric switches. These features have now been incorporated into a plug-in for OpManager.
OpManager, like Nagios, is general network monitoring software. With the addition of OpStor, it includes the capability to monitor the performance of your storage devices. It offers monitoring for RAIDs to determine capacity, configuration, and performance metrics. In addition, it looks at controllers and their status, LUNs, volumes, and virtual disk groups, and provides statistics and report data for each one.
It can also automatically discover the tape libraries in SAN and NAS networks to detect status, health, and faults. And its reporting function provides historical storage data to help you forecast potential capacity and plan to accommodate it.
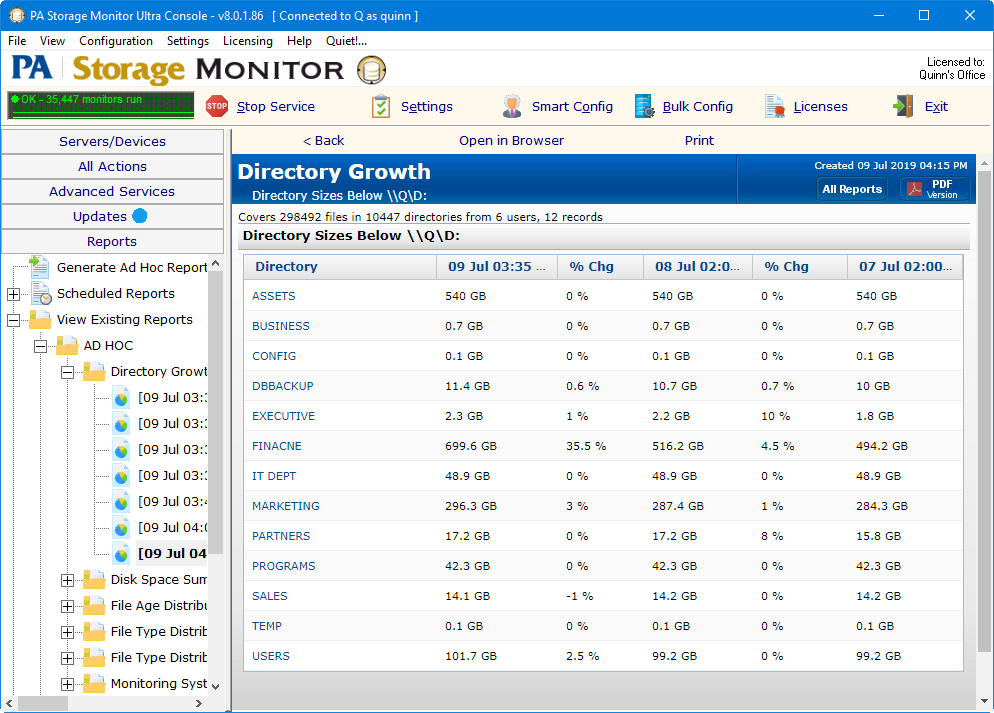
PowerAdmin Storage Monitor is a more lightweight product than the SolarWinds and Nagios offerings above. It provides disk space monitoring, directory change monitoring, a volume cataloguer, file size monitoring, and user and directory quota monitoring.
All these monitoring tools also produce accompanying reports to show you when files and directories were last accessed, which users are consuming the most storage, whether you have any duplicate files in your system, and which files are the largest. These tools and reports can help you to streamline and organize your storage systems for greater performance.
The primary focus of PA Storage Monitor is on file management rather than system or network management, but it can be a useful accompaniment to a more comprehensive tool if you have a lot of data to manage.
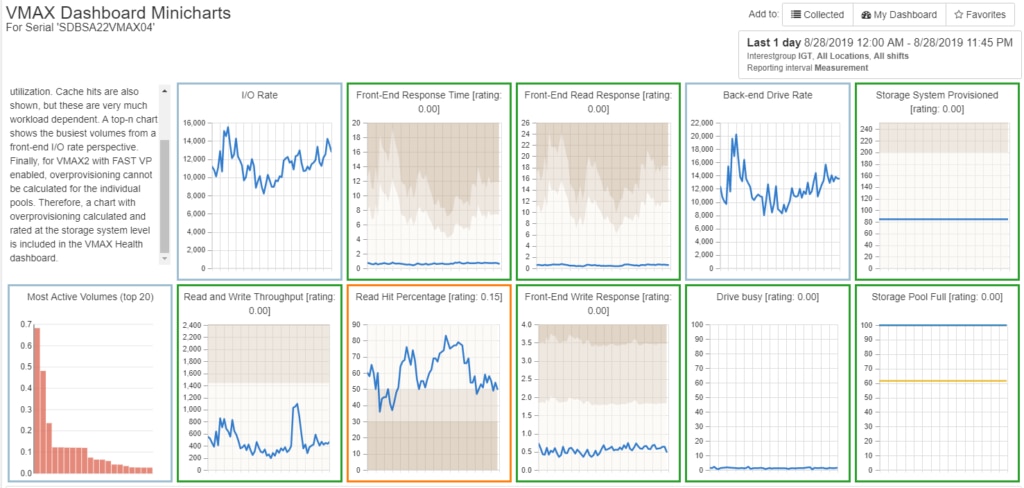
IntelliMagic Vision for SAN is a focused storage monitor with an emphasis on SAN monitoring. It monitors multi-vendor SAN storage, as well as VMware storage setups and storage fabric. Highlights include impressive visualizations and graphs, as well as a centralized dashboard to provide “health at a glance” information about all your storage infrastructure.
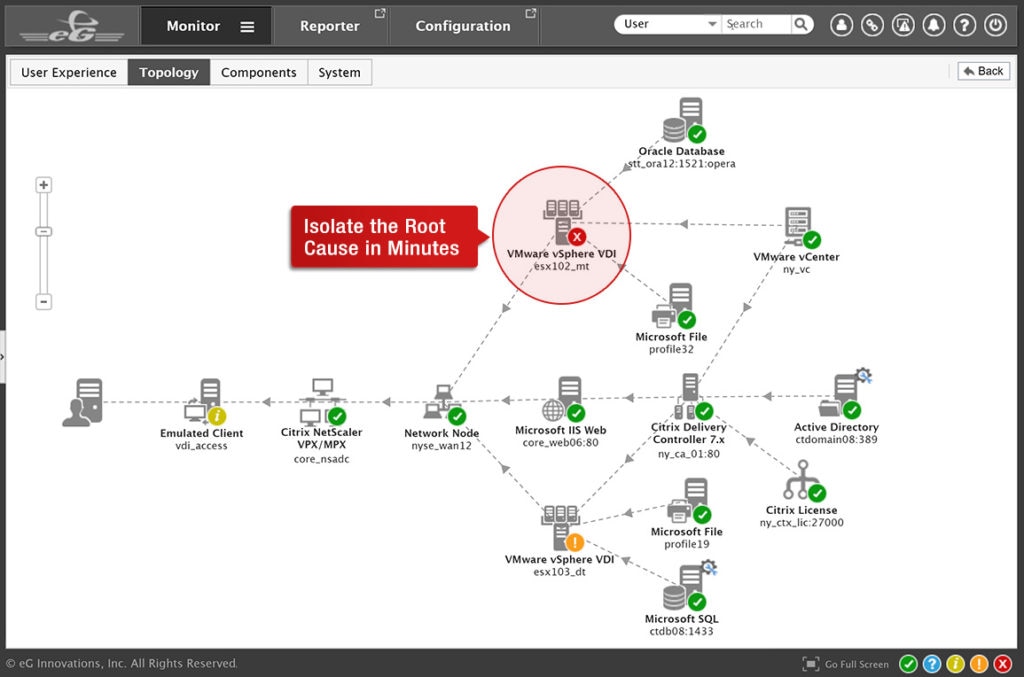
Like the bulk of the products on this list, eG Enterprise is a comprehensive network monitoring tool with SAN storage monitoring capabilities. It provides performance monitoring across the entire infrastructure, which allows you to see whether network or performance problems originate with physical components, storage, bandwidth hogs, applications, servers, or virtual machines. It bills itself as a “proactive monitoring tool” developed to aid in early detection of issues. Its focus is primarily on alerts and reports, though it also provides analysis to guide you in troubleshooting.
Benefits of Storage Management Tools
As networks and devices grow more complex, businesses are faced with the need for effective storage management. Without appropriate management tools, you risk running out of storage when you need it most, and you might encounter issues with functionality.
I recommend using a tool like SolarWinds SRM due to its robust reporting function and the option to create both predefined and customized reports on data including LUN performance—for example, top 10 LUNs by latency—capacity summaries, storage utilization, and information on your hardware. This is particularly useful when you want to forecast your storage capacity.
If you work at home or manage the network for a small business, you might also benefit from a free tool from SolarWinds called Storage Performance Monitor (SPM). SPM provides some of the same features as SRM: it allows support for multi-vendor storage arrays, as well as storage I/O hotspot detection. However, for a large business or enterprise setting, SRM is the way to go, as SPM won’t provide all the tools you need for managing a large storage infrastructure.


