If your virtual machines are slow or underperforming, monitoring key VM performance metrics and running appropriate VM performance tests is key to improving overall VM performance. This guide will explain the most important VM performance metrics and provide an outline of the three main VM performance test types.

An underperforming VM can be improved and optimized efficiently and rapidly if your business is using the right VM performance monitoring and testing tools and leveraging data to make proactive improvements. SolarWinds® Virtualization Manager (VMAN) is a versatile VM monitoring tool designed to help businesses address VM performance issues by providing deep and actionable insight into VM performance metrics. With VMAN, you can
- Observe key metrics related to the performance of virtual machines on your computer network
- Access an environment view with mapped VMs and their related objects, datastores, and dependent hosts
- Monitor environment tests inside your network, as well as external virtualization services such as VMware, Nutanix, hybrid environments ,and hypervisors
You can access a 30-day free trial of SolarWinds VMAN here.

Key VM Performance Metrics
Virtualization and the existence of VMs has introduced new data center management challenges. In virtualized environments, applications must compete for dynamic, shared infrastructure resources, including CPU cycles, memory, and storage. If not managed appropriately, this can cause resource allocation issues and result in performance issues.
Because you can monitor thousands of VM performance metrics, identifying which ones are important can be challenging. You should be actively monitoring the most important VM performance metrics:
- CPU Extra Summation, which indicates when a CPU processing speed and I/O traffic mismatch is occurring.
- CPU Ready Summation, which can be used to assess whether a virtual machine is experiencing CPU ready problems.
- CPU Usage Average, which measures how much physical CPU is being used.
- Disk Bus Reset, which refers to when all queued HBA or Disk Bus commands are wiped out. This metric measures at what point a disk bus reset occurs.
- Disk Commands Aborted Summation, which shows how many times requests have been sent to disk, but the commands aborted.
- Disk Total Latency Average, which indicates how much disk latency is occurring.
- Disk Queue Latency Average, which shows how long a command is left waiting in a queue for disk processing.
- Throughput, which averages the Disk Write Average and Disk Read Average metrics.
- Active Guest Memory, which indicates how much memory is being actively consumed by the VM.
- Overhead Consumption, which shows how much memory consumed to run a specific VM.
- Private Guest Memory, which refers to how much memory backed physically by the relevant host.
- Ballooned Memory, which measures how much guest physical memory currently reclaimed via balloon driver.
- Unaccessed Memory, which indicates how much memory is not currently accessed by VM.
VM Performance Testing
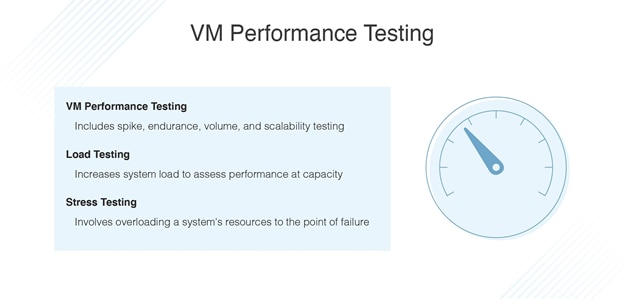
VM performance tests play a crucial role in improving and maintaining VM performance. A VM performance test can help businesses identify where VM performance issues originate. Three key test types should be leveraged during VM performance optimization activities. These include performance testing (as an umbrella term), load testing, and stress testing.
1. Performance Testing
Administrators leverage VM performance testing to assess how various system components cope with different circumstances. VM performance testing typically involves validating scalability, reliability, and resource usage. There are different performance test types, including spike testing, endurance testing, volume testing, and scalability testing. Because of this, the phrase “performance testing” can be used as a broad term but also refers to more specialized test types.
The goal of VM performance testing is to determine an appropriate performance benchmark. Although many benchmarks are industry-specific, and are certainly worth considering, your business’ benchmarks should be tailored to your individual business needs and reflect service level agreements (SLAs.) Your VM performance test benchmarks should cover resource usage, throughput, speed, stability, and response time. If your VM performance tests are effective, it will enable you to project VM performance issues.
2. Load Testing
A load test is a VM performance test type for assessing VM performance by continuously and steadily increasing load until the VM’s capacity has been reached. If you’re leveraging the right VM performance tools, you can conduct load testing quickly and efficiently. Although similar, load testing is not to be confused with volume testing, which is usually for testing databases. Load testing is also different from endurance testing, which assesses how much VMs or systems can cope with by subjecting them to a high load for a sustained time period.
Load testing is a highly effective way of determining how much a system or VM can withstand because it pushes them to the limit and monitors the results. You might also leverage load testing by giving a system an empty task, so you can monitor and assess how your VM or system copes with zero-load instances.
A typical load test will monitor key attributes and metrics, including peak performance, server throughput, adequacy of the H/W environment, and how response times vary based on load levels. Load tests can also reveal how much pressure can be put on a system before performance begins to suffer. The purpose of a load test is to expose defects, such as memory mismanagement, buffer overflow, and memory leads. You can also use load tests to reveal current system capacity, bandwidth issues, load balancing problems, and more.
3. Stress Testing
Stress testing is a subset of performance testing that involves overloading a system’s existing resources with more tasks than it can manage with the aim of making the system fail. Another type of stress test, called negative testing, involves taking system components away. Stress testing, which is also referred to as fatigue testing, is used by administrators to assess an application or system’s stability, which is achieved by overwhelming the bandwidth threshold. This type of testing can give administrators deeper insight into how an application or VM behaves under peak load or abnormal conditions.
We use stress tests to determine what conditions are likely to make a system fail, which enables you to observe and assess how the system recovers. Successful stress tests will be performed in controlled environments and repeated several times, but under different conditions, which provides visibility into how systems cope with each unique circumstance.
Effective stress testing can expose memory leaks, race conditions, synchronization issues, and other problems. The two most common stress testing types are spike testing and soak testing. Spike testing aims to assess how a system responds when the number of users spike. Soak testing, on the other hand, assesses system sustainability over a certain period of time by gradually increasing the number of users.
SolarWinds Virtualization Manager
SolarWinds Virtualization Manager (VMAN) reduces the stress of managing VM performance by offering VM performance tool data utilities designed to assist IT professionals with monitoring and optimizing VM performance.

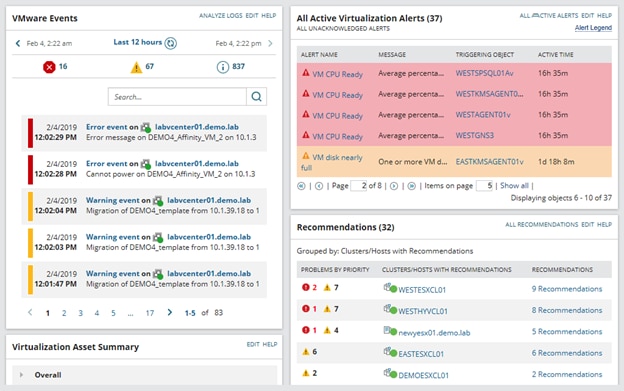
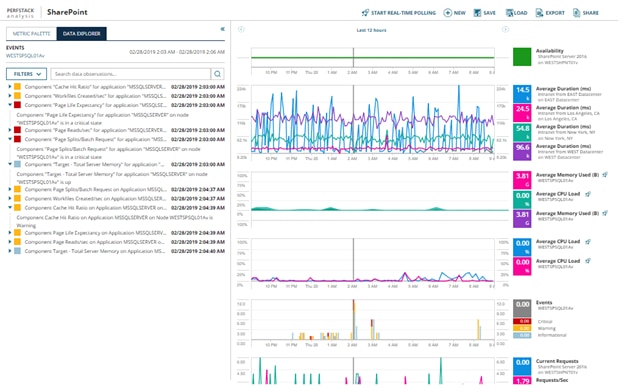
During my research I got to know VMAN as a highly user-friendly tool with customizable dashboards purpose-built to give visual, instant insight into your VM environment’s health. VMAN gives me the option of displaying its VM performance tool data in multiple views, including an environment view. The environment view maps VMs automatically to their related objects, datastores, and dependent hosts, giving me immediate insight into the relationship between VM performance and hardware performance.
I highly recommend this versatile VM performance tool data monitoring solution. It allows you to monitor the performance and health of Microsoft Hyper-V hypervisors, Nutanix AHV, and VMware, whether on-premises, hybrid, hyperconverged, or in the cloud during VM performance stress testing.
VMAN includes sprawl management, capacity planning utilities, and is built to provide you with complete visibility across the application stack, to provide a versatile, all-in-one VM management solution starting at US$1,716. If you want to test this tool in your organization, use the 30-day free trial version. It’s available for download from the SolarWinds website.
Getting Started With VM Performance Monitoring
With the right VM performance tool data, companies can establish a robust and efficient VM performance monitoring strategy that combines performance testing and tuning to mitigate the chance of performance problems arising. With comprehensive and sophisticated VM performance tools, VM performance tuning and monitoring can be significantly easier. SolarWinds VMAN can streamline your VM performance management activities, automate processes, and facilitate continuous monitoring to help you establish and maintain high VM performance. A fully functional 30-day free trial is available.


